Advanced Knowledge Base

1.Getting Started
Welcome to Planium Pro. If you are just getting started, this article will teach you the basics of Planium Pro and how to use key features. Choose or navigate to a section to get started on a particular topic.
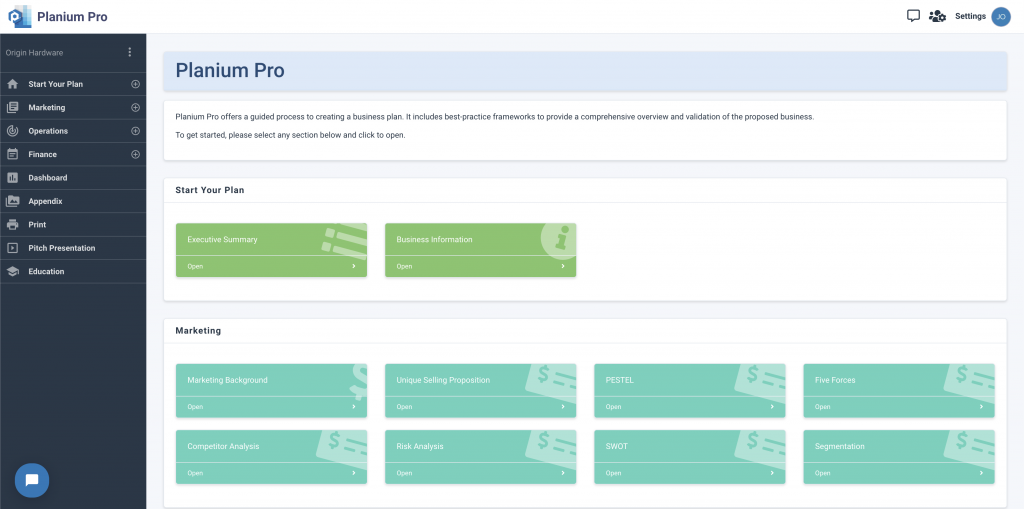
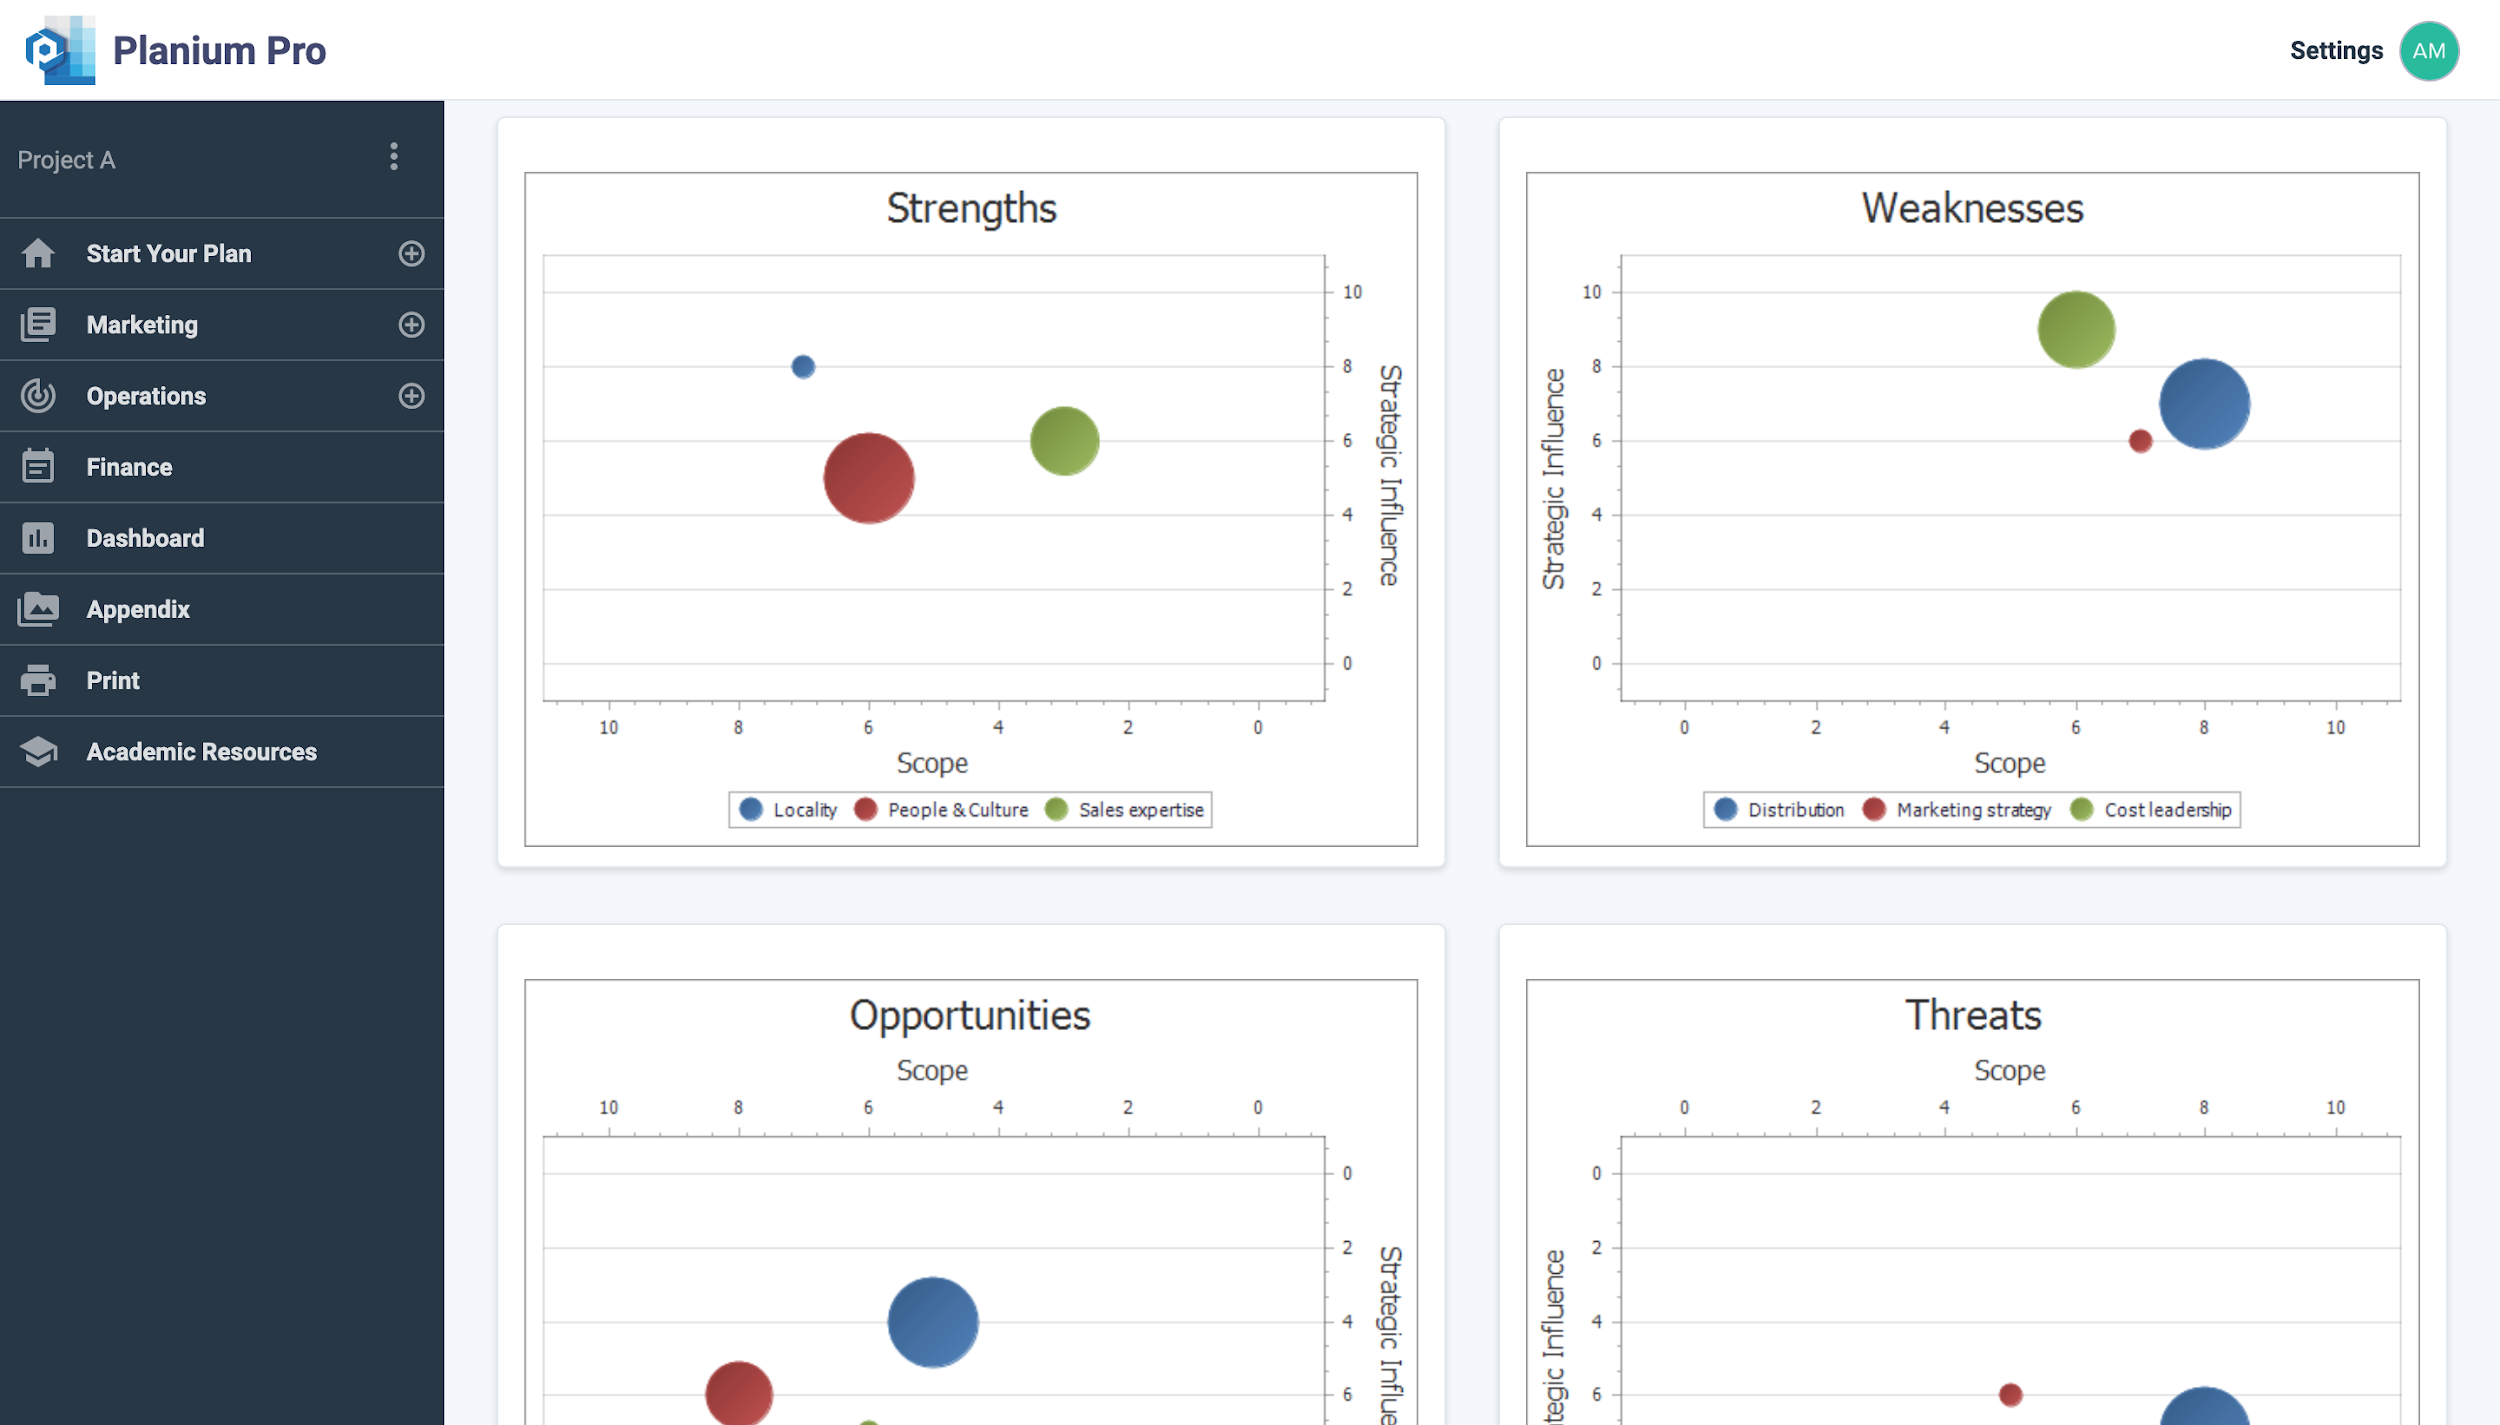
Below is the main Planium Pro interface. After creating a project, start here to navigate to each section of your business plan.
2.Marketing
This section clearly defines and describes the business’ target market and competitors. Frameworks to assist with this analysis include PESTEL, Five Forces, SWOT, Risk Analysis, Segmentation and Competitor Analysis.
2.1.PESTEL Analysis
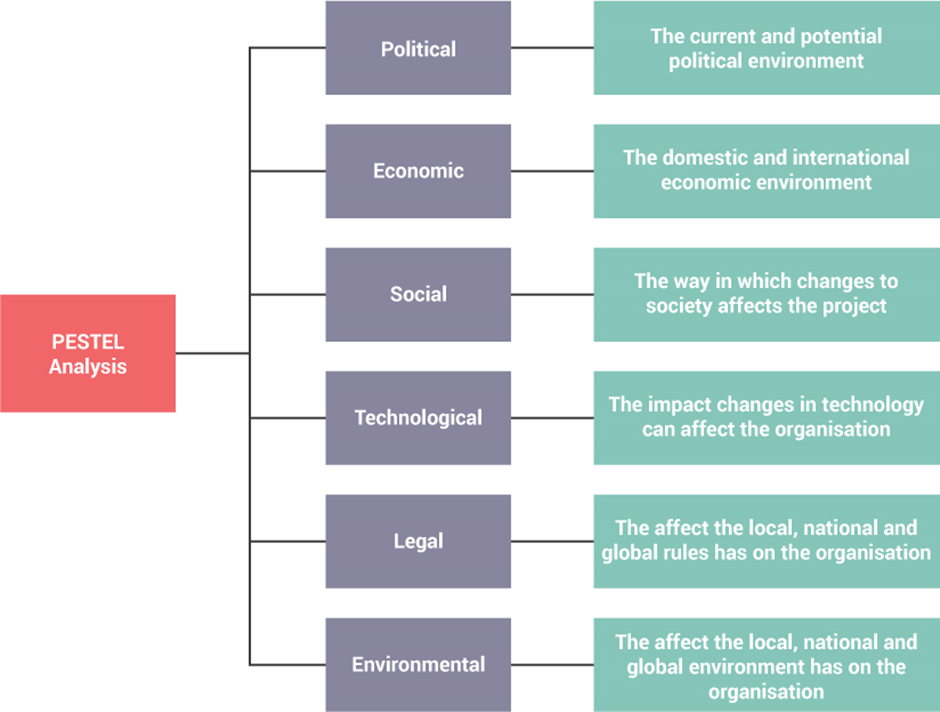
PESTEL is an analytical tool which considers external factors and helps to analyse the impact on the organisation or project. This analysis was originally created by Harvard professor Francis Aguilar as a scanning tool with the acronym “ETPS” which stood for Economic, Technical, Political, and Social. This was further developed in the 1980s by several other authors later to create the PESTEL acronym which stands for Political, Economic, Social, Technological, Environmental and Legal. There are many benefits of PESTEL:
- It helps organisations to understand the big picture of the environment in which they are operating and be able to minimize the threats and take advantage of the opportunities.
- Encourages firms to think about the wider environment from a short- and long-term perspective.
- It helps to identify business opportunities and gives insight into significant threats.
PESTEL forms part of a strategic plan and should be repeated at regular stages—minimum 6 months’ period—as the macro environment is constantly changing. By conducting regular reviews organisations will be able to create a competitive advantage.
Using PESTEL Analysis on Planium Pro
To complete section, on the left-hand side menu bar, click the + to expand the ‘Marketing’ menu and select ‘PESTEL’.
To input the information, click ‘New’ in each table use the table in the software and explanations below to guide you.
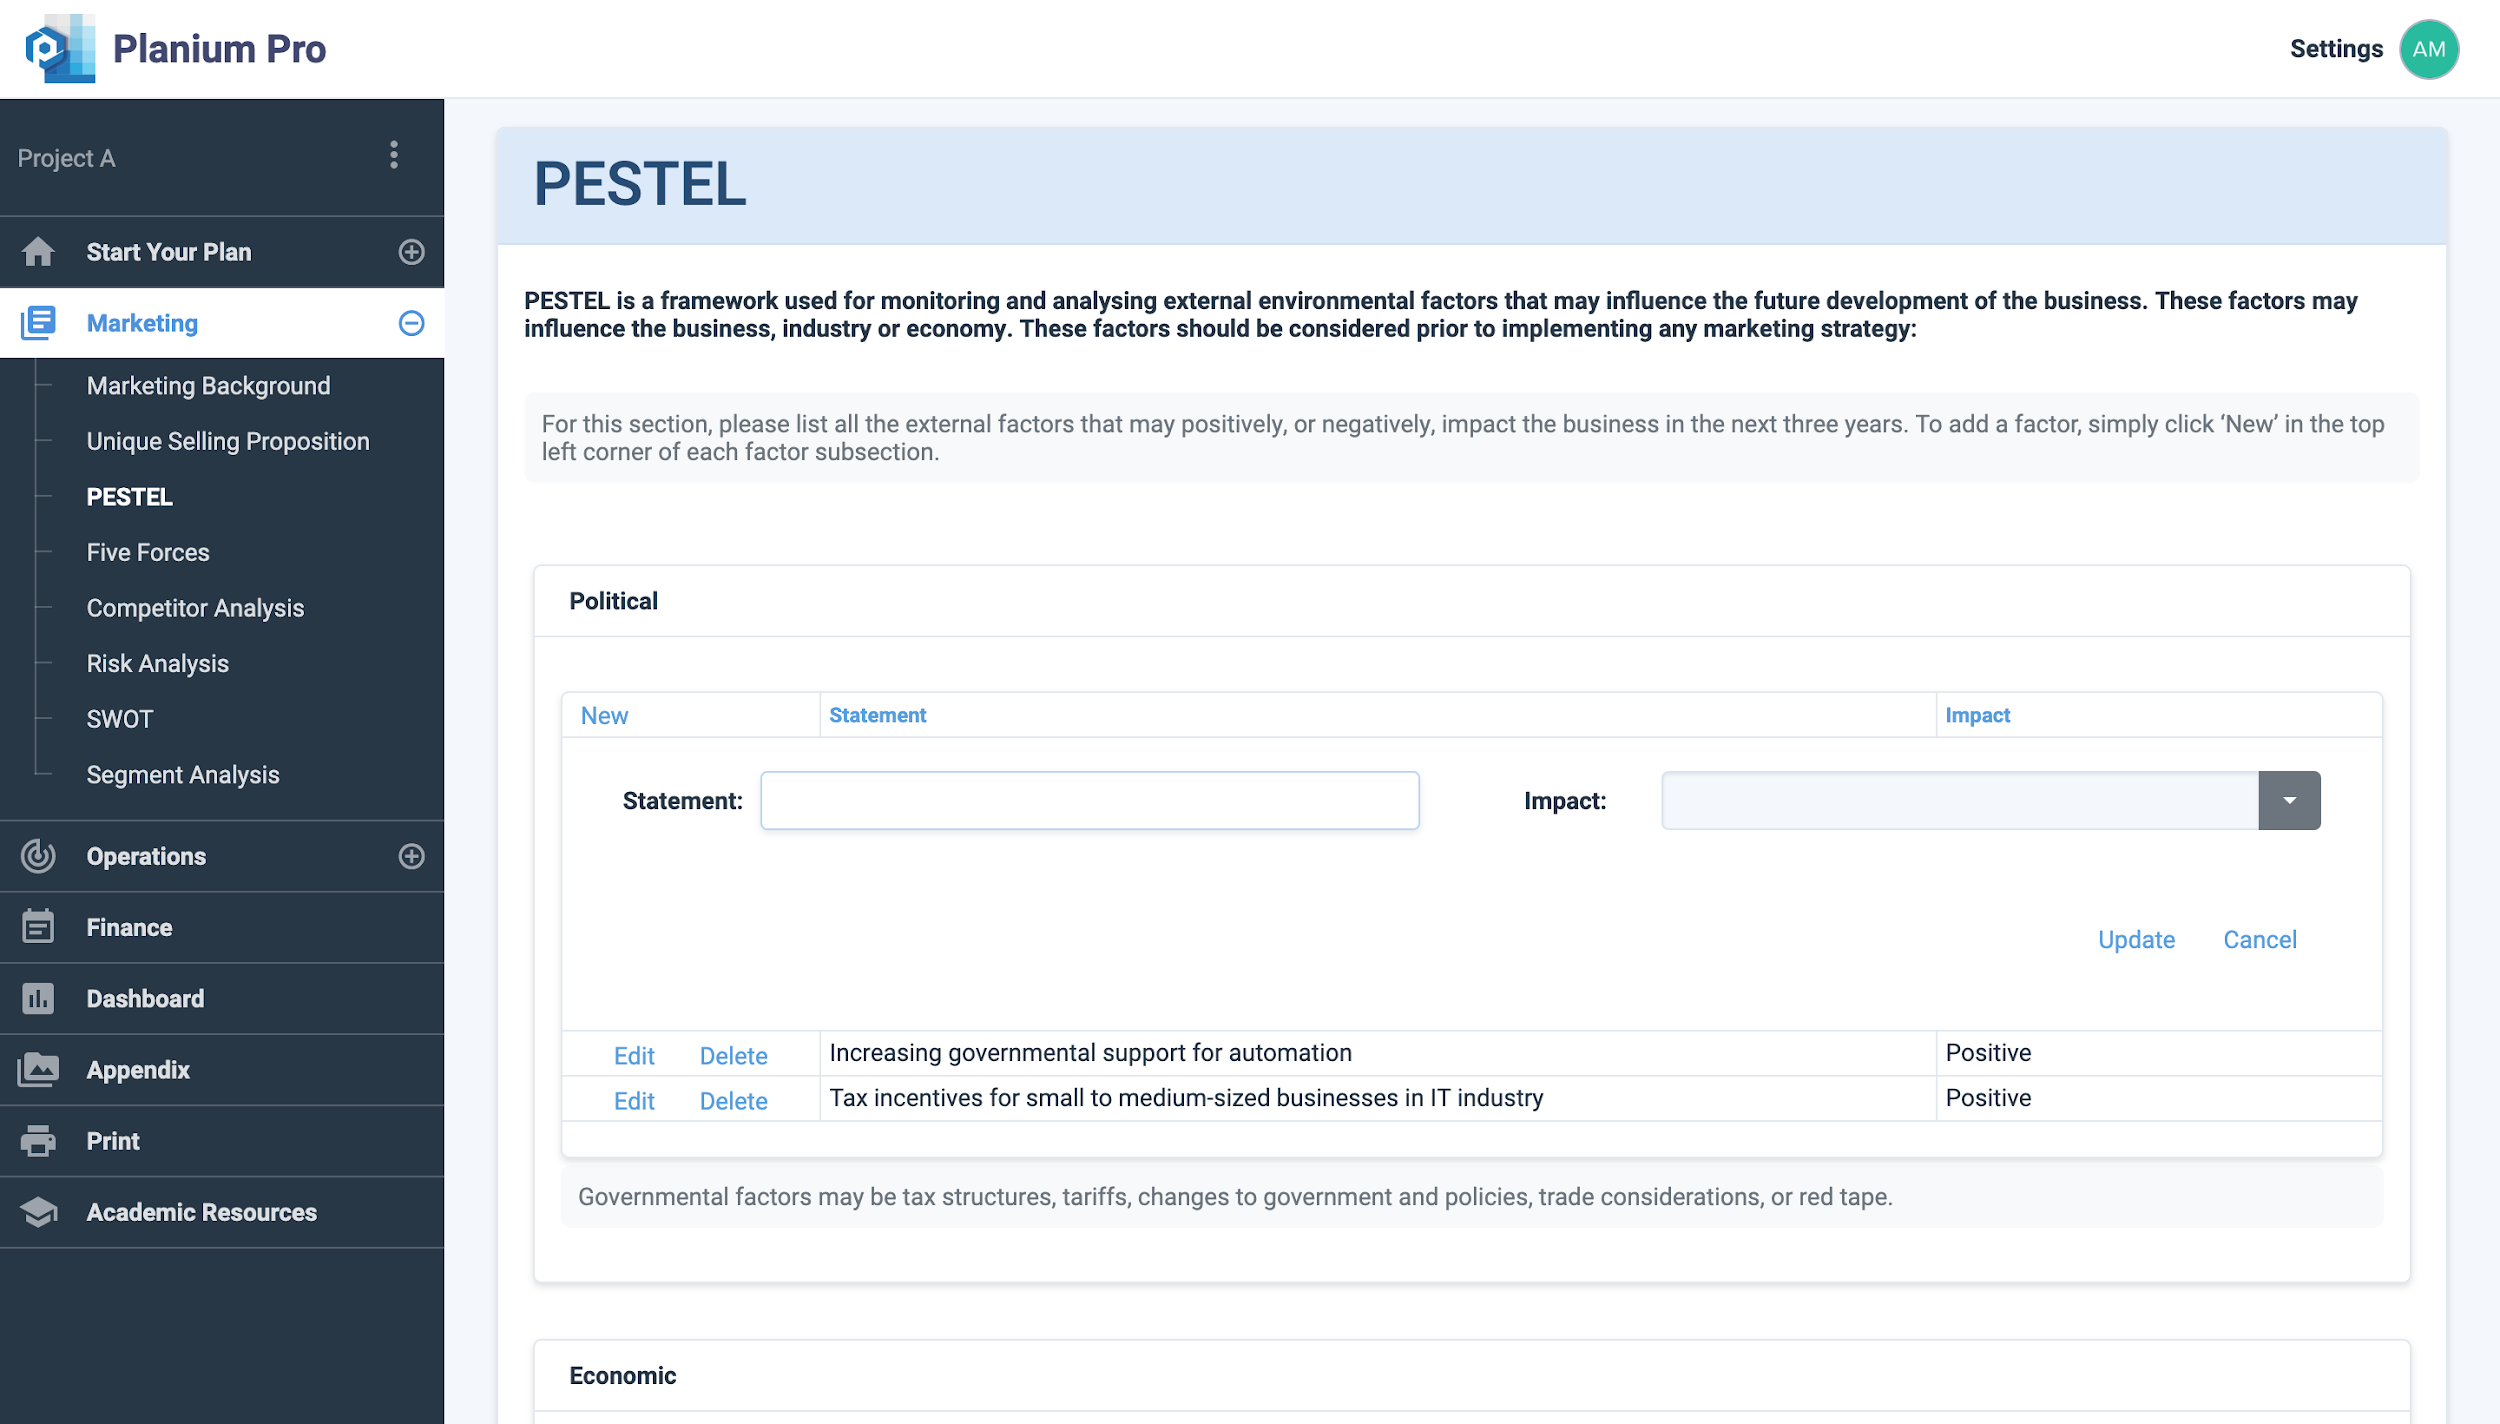
1. Political:
Enter the governmental factors that will or could influence the business or project over the next 3 years. Examples include: tax structures, tariffs, changes to government and policies, trade considerations, and “red tape”.
2. Economic:
Enter the economic factors that will or could influence the business or project over the next 3 years. This includes interest and exchange rates, credit policies, government subsidies, economic growth or stall, target customers’ capacity to spend, and effects of globalisation.
3. Social:
Enter the social factors that will or could influence the business or project over the next 3 years, such as population growth, demographics, cultural differences, wealth distribution, patterns of education, employment and social mobility, and consumer attitudes.
4. Technological:
Enter the influence of technology on the business or project, including the growth of automation and AI, new innovations, pace of technological advancements adoption of new technologies, R&D activities and incentives/ grants for new technology.
5. Environmental:
Enter the environmental factors that will or could influence the business or project over the next 3 years. Consider environmental protection laws, consumer attitudes, the effects of climate and climate change, energy and resource consumption regulations.
6. Legal:
Enter the legal factors influencing the business or project over the next 3 years. This could include health and safety standards, industrial relations laws, consumer rights, employment regulations, and IP protection.
Any other information applicable to this section:
Include any information relevant to this section that was not included in the previous steps.
Click ‘Save’ to save.
Click ‘Chart Preview’ to view the analysis results.
Analysing PESTEL Results on Planium Pro
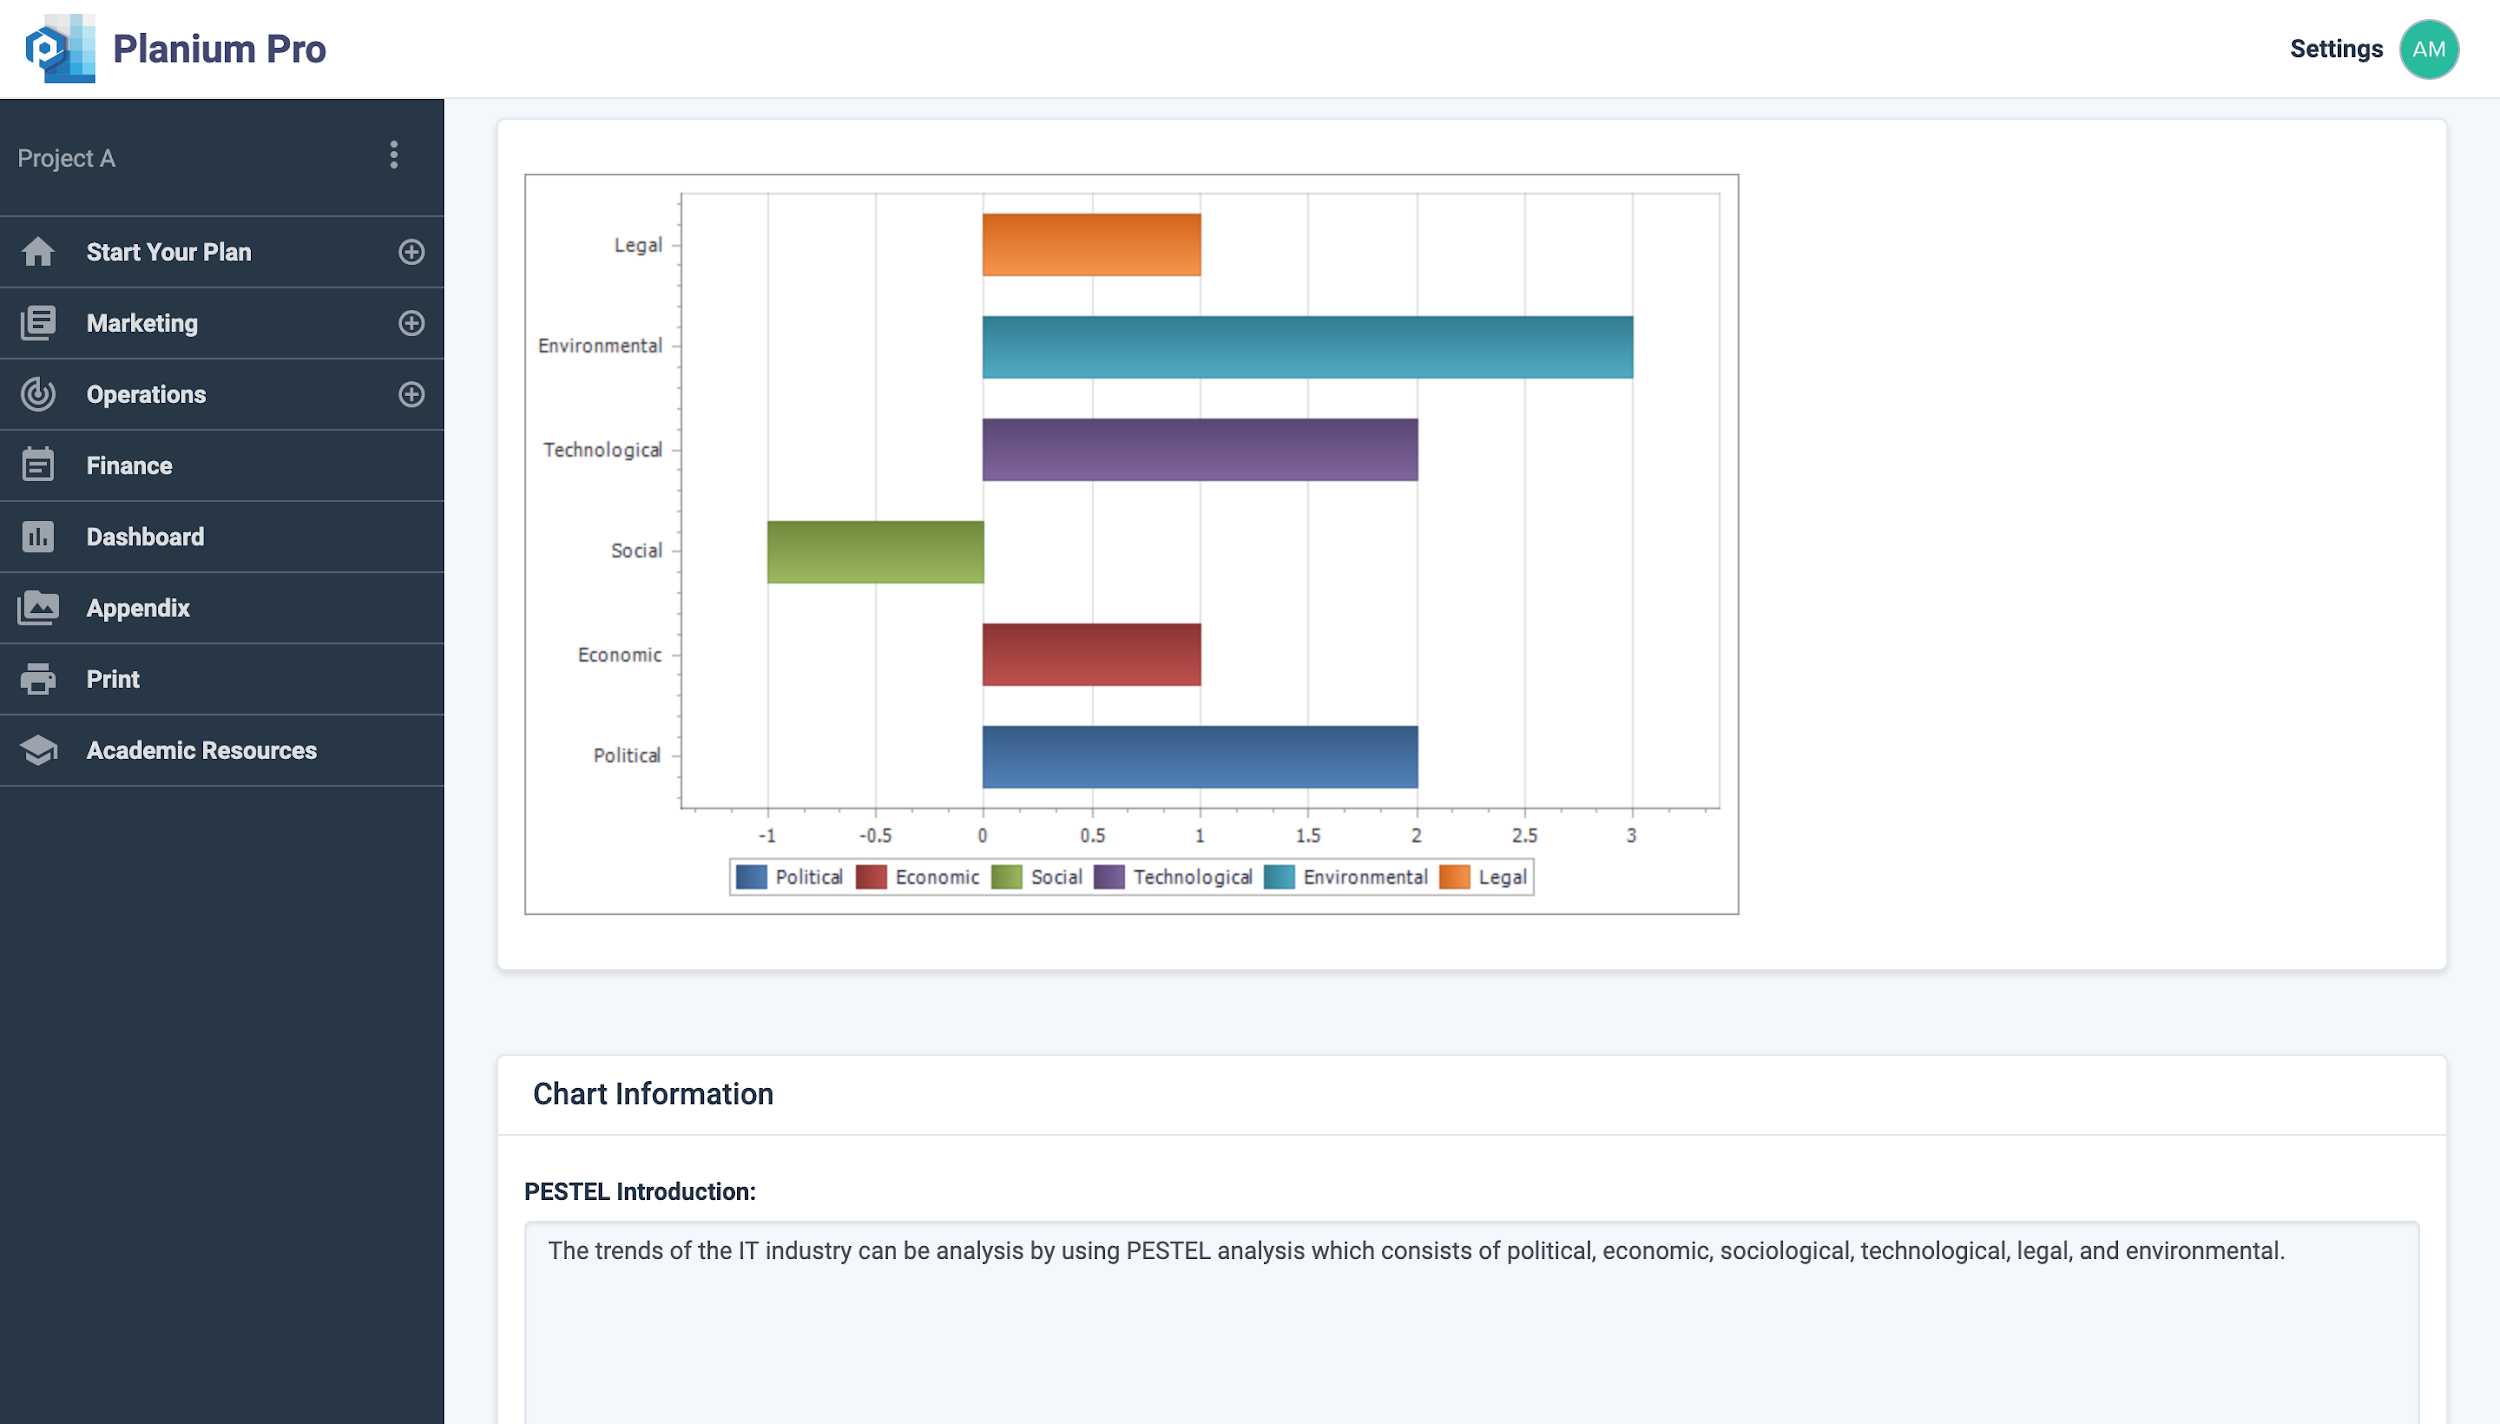
Under ‘PESTEL Introduction’, you can input any introductory information that may benefit your client or investor.
‘Analysis Results’ is the section to write-up the analysis on the graph and describe any key themes that are present in the data.
Click ‘Save’ to save.
Click ‘Report Preview’ to view the write-up in report format.
2.2.Five Forces
Five Forces is a framework developed by Harvard professor Michael Porter in 1979. It has become one of the most useful and popular business strategy tools because it helps companies assess industry attractiveness, how trends will affect industry competition, which industries a company should compete in and how can position themselves for success (Porter 1987). An attractive market is one where there is higher overall predicted profitability.
The Five Forces analysis consists of five substeps:
- Market competitiveness
- Bargaining power of buyers
- Threat of substitution
- Threat of new entrants
- Bargaining power of suppliers
Using Five Forces Analysis on Planium Pro
To complete section, on the left-hand side menu bar, click the + to expand the ‘Marketing’ menu and select ‘Five Forces’.
When responding to the questions below, consider the main market the business plans to launch in. Please maintain the boundaries of this market in the responses. The average score, minimum score, and maximum score will be automatically calculated based on the numbers input in each field.
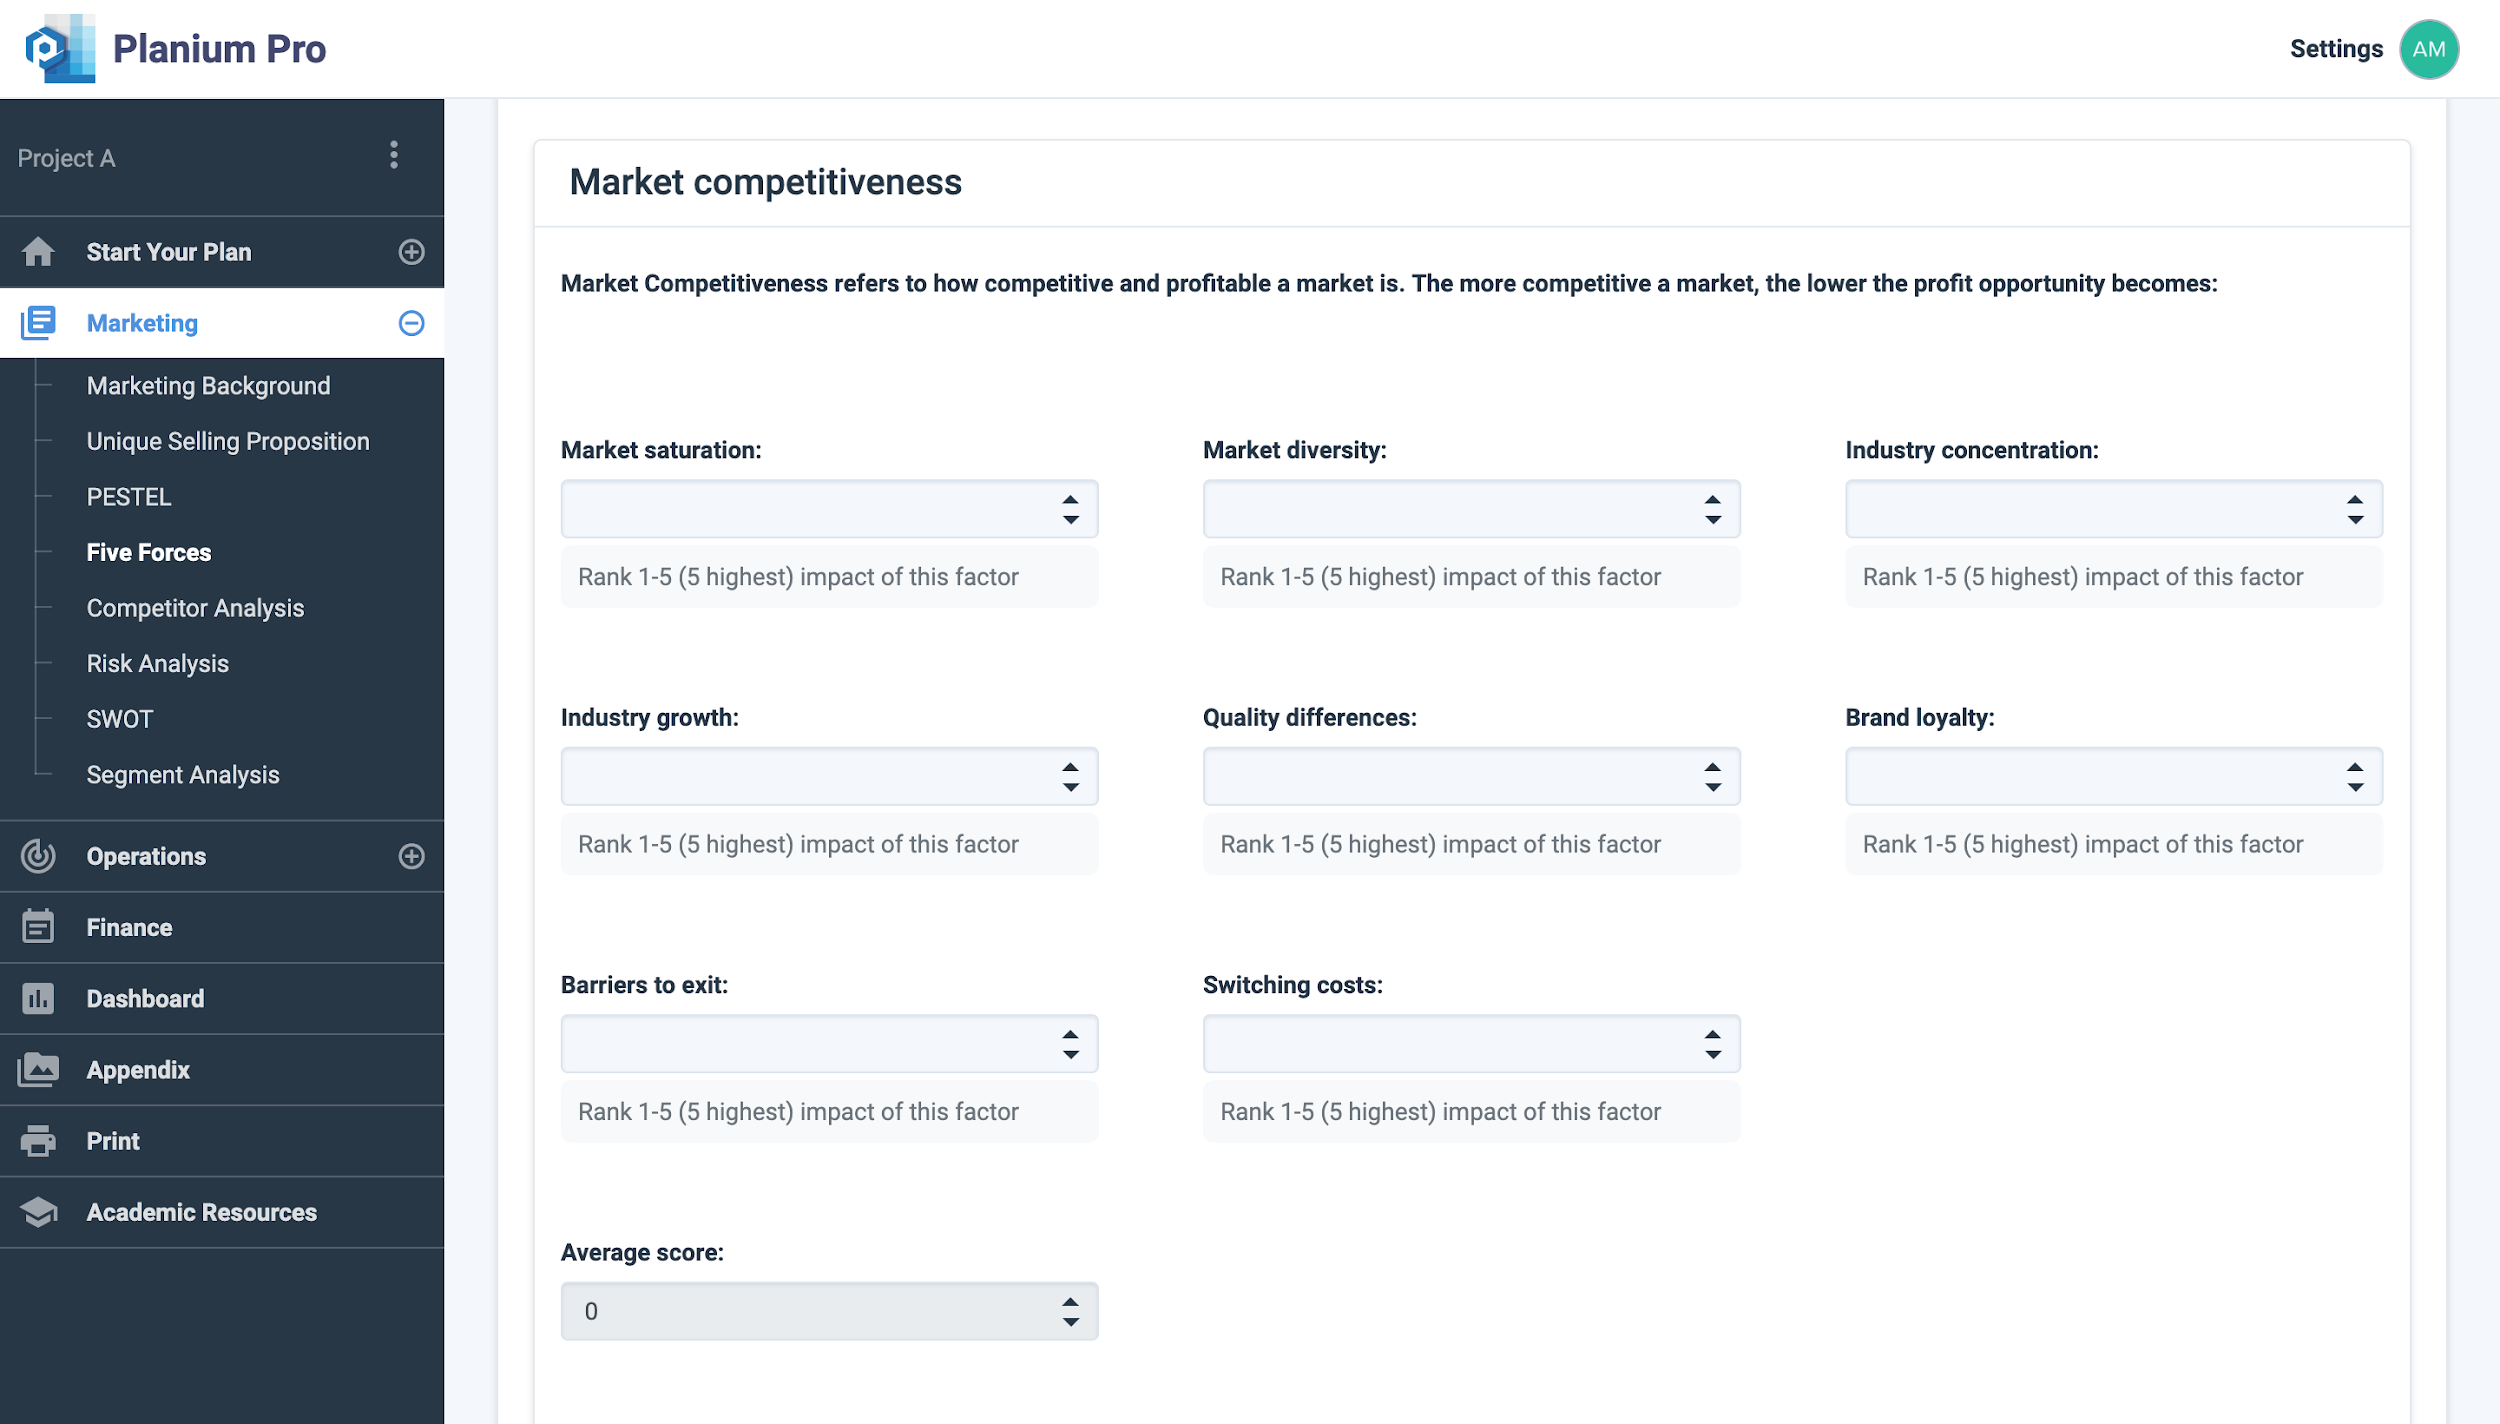
1. Market Competitiveness
This refers to how competitive and profitable a market is. The more competitive a market, the lower the profit opportunity becomes. Consider how competitive the industry is for the business or project to sell to customers. This includes the number of competitors in the industry, the presence of substitute products or services, and the power of customers to influence business.
Rank the main market on each of the criteria below, from 1 (very low) to 5 (very high).
- Market saturation: Number of competitors.
- Market diversity: Diversity of competition.
- Industry concentration: Concentration ratio of an industry.
- Industry growth: Pace of growth of an industry.
- Quality differences: Key differences between companies.
- Brand loyalty: How loyal customers are.
- Barriers to exit: Companies can only stay within this market.
- Switching costs: The cost to switch if a buyer is dissatisfied.
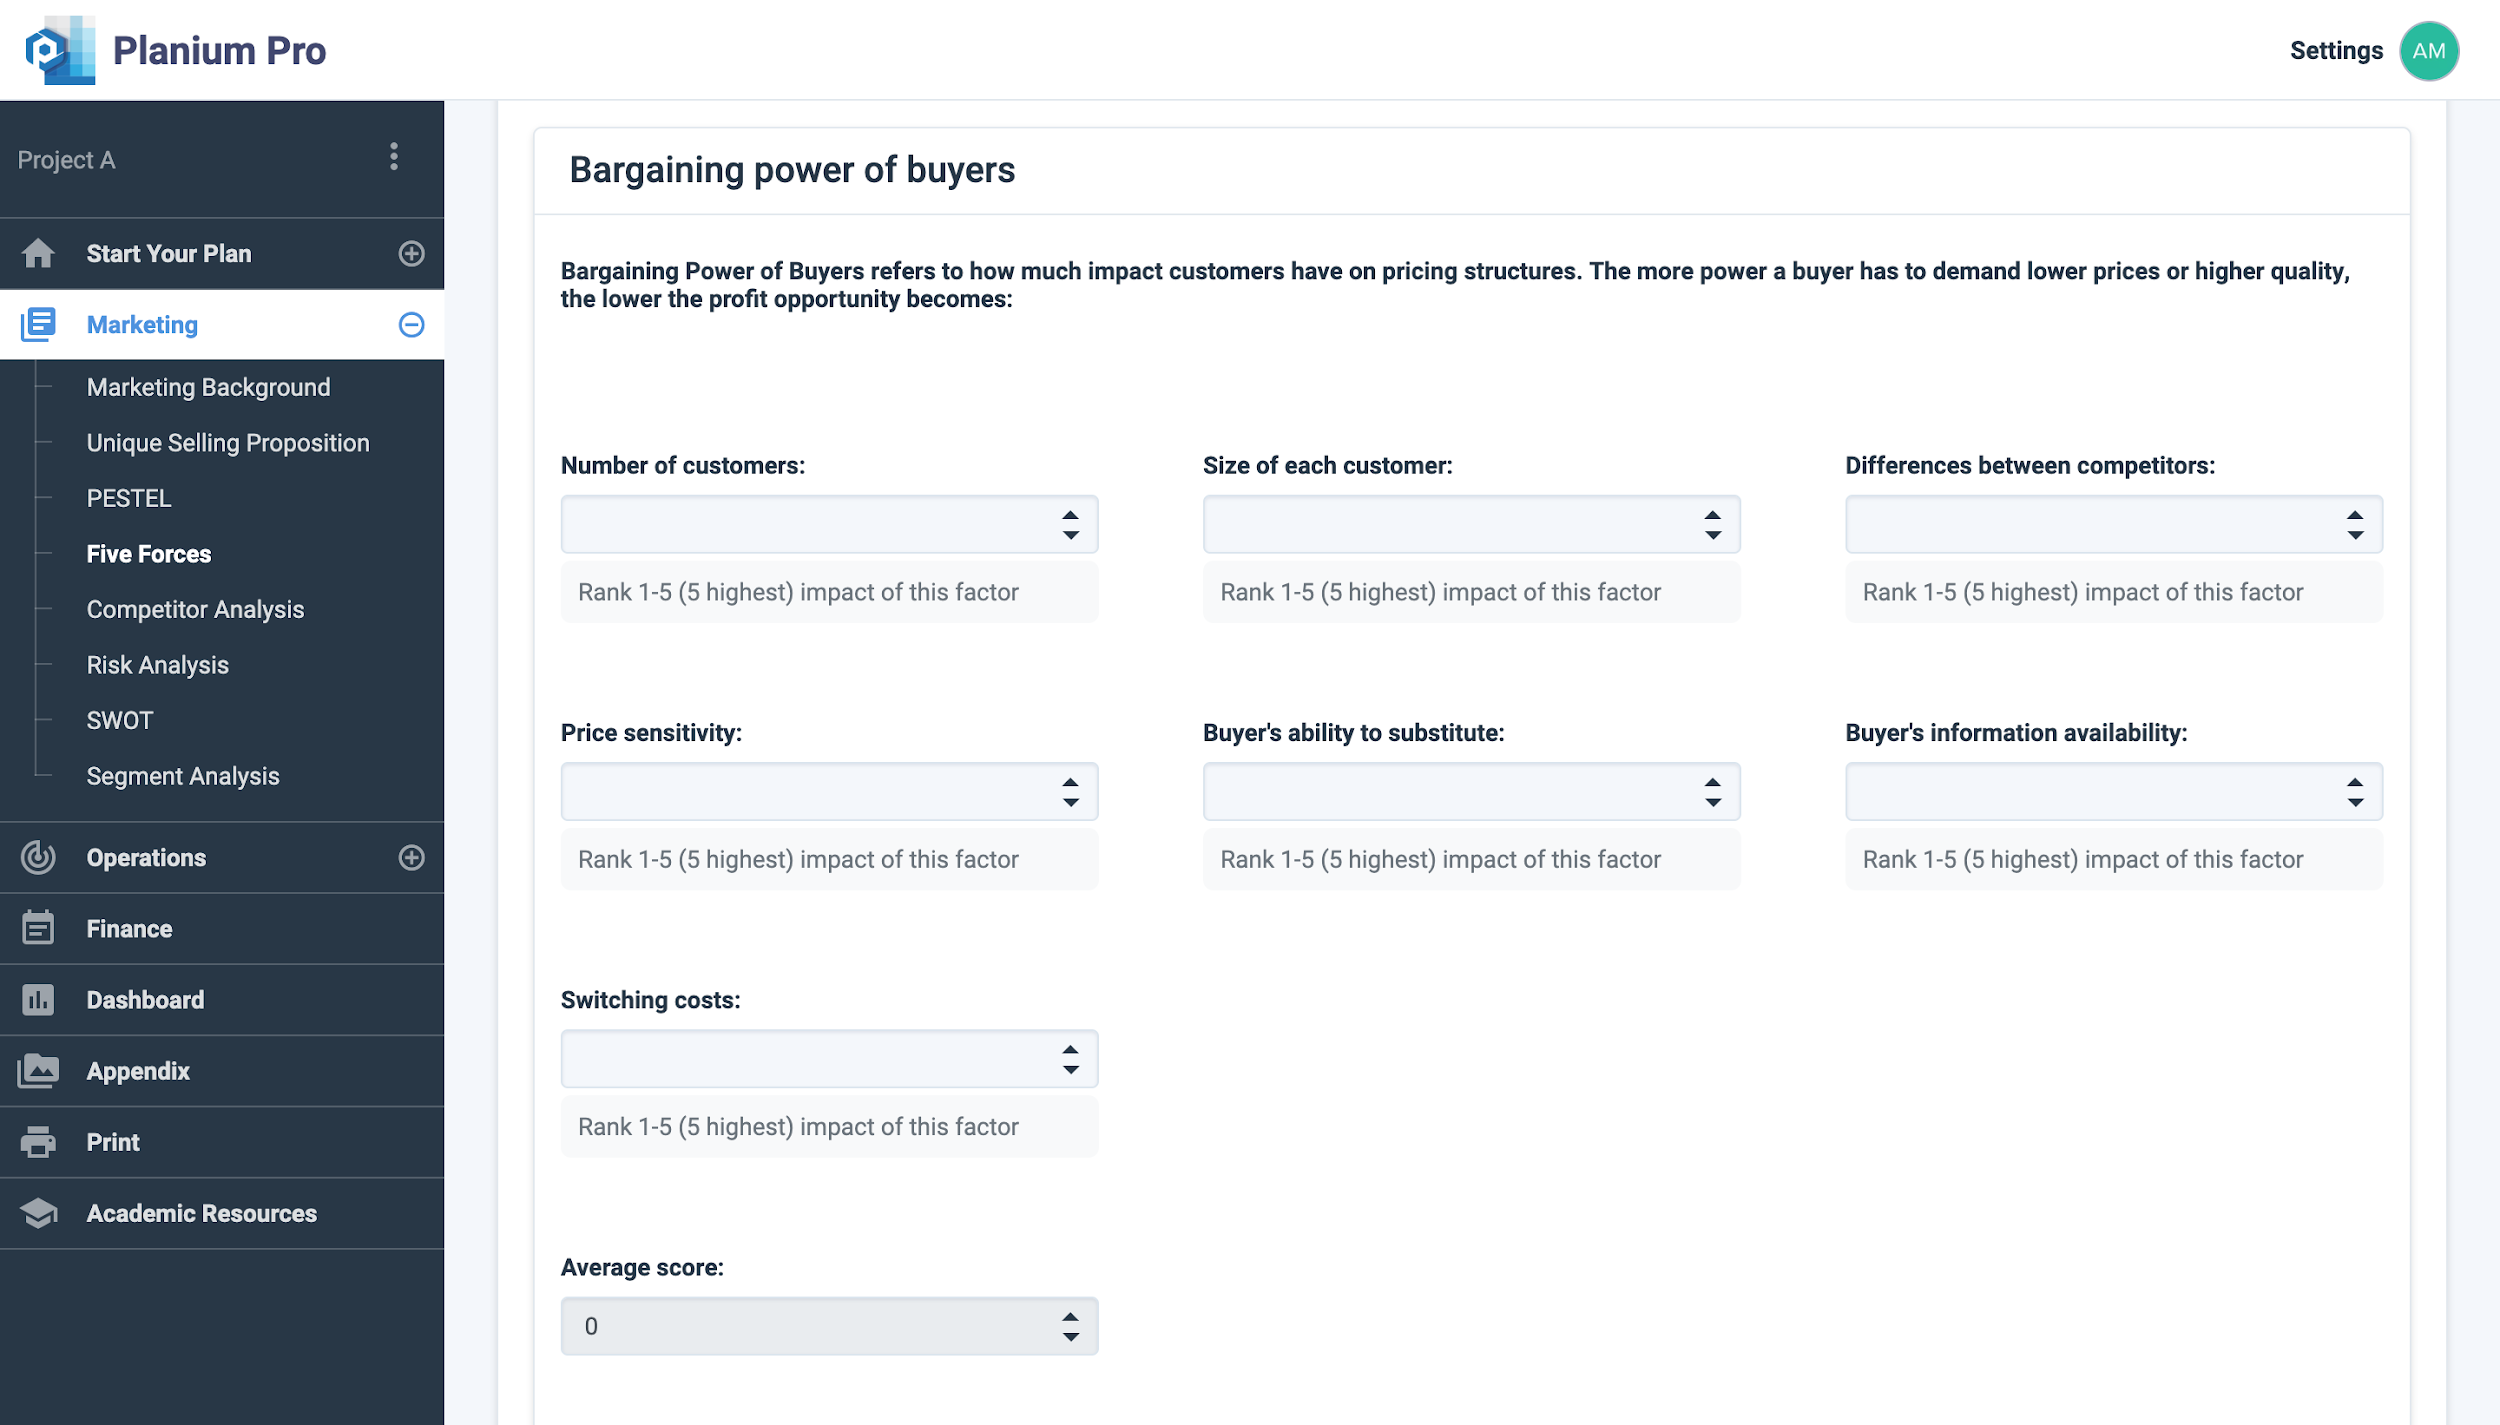
This refers to how much impact customers have on pricing structures. The more power a buyer has to demand lower prices or higher quality, the lower the profit opportunity becomes. Detail the level of impact customers have on the business or projected if they choose to switch to other providers. The level of power customers hold depends on the industry, for instance, few buyers and numerous sellers gives the customer greater influence.
Rank the main market on each of the criteria below, from 1 (very low) to 5 (very high).
- Buyer concentration: Number of customers.
- Size of each customer: Number of orders per buyer.
- Differences between competitors: How different competitors are from one another.
- Price sensitivity: Buyers sensitive to changes in price.
- Available substitutes: Number of alternatives or substitutes available.
- Buyer’s information availability: Buyer ability to gather information about companies.
- Switching costs: The cost to switch if a buyer is dissatisfied.
Finally, in the box add any other information applicable to Bargaining Power of Buyers.
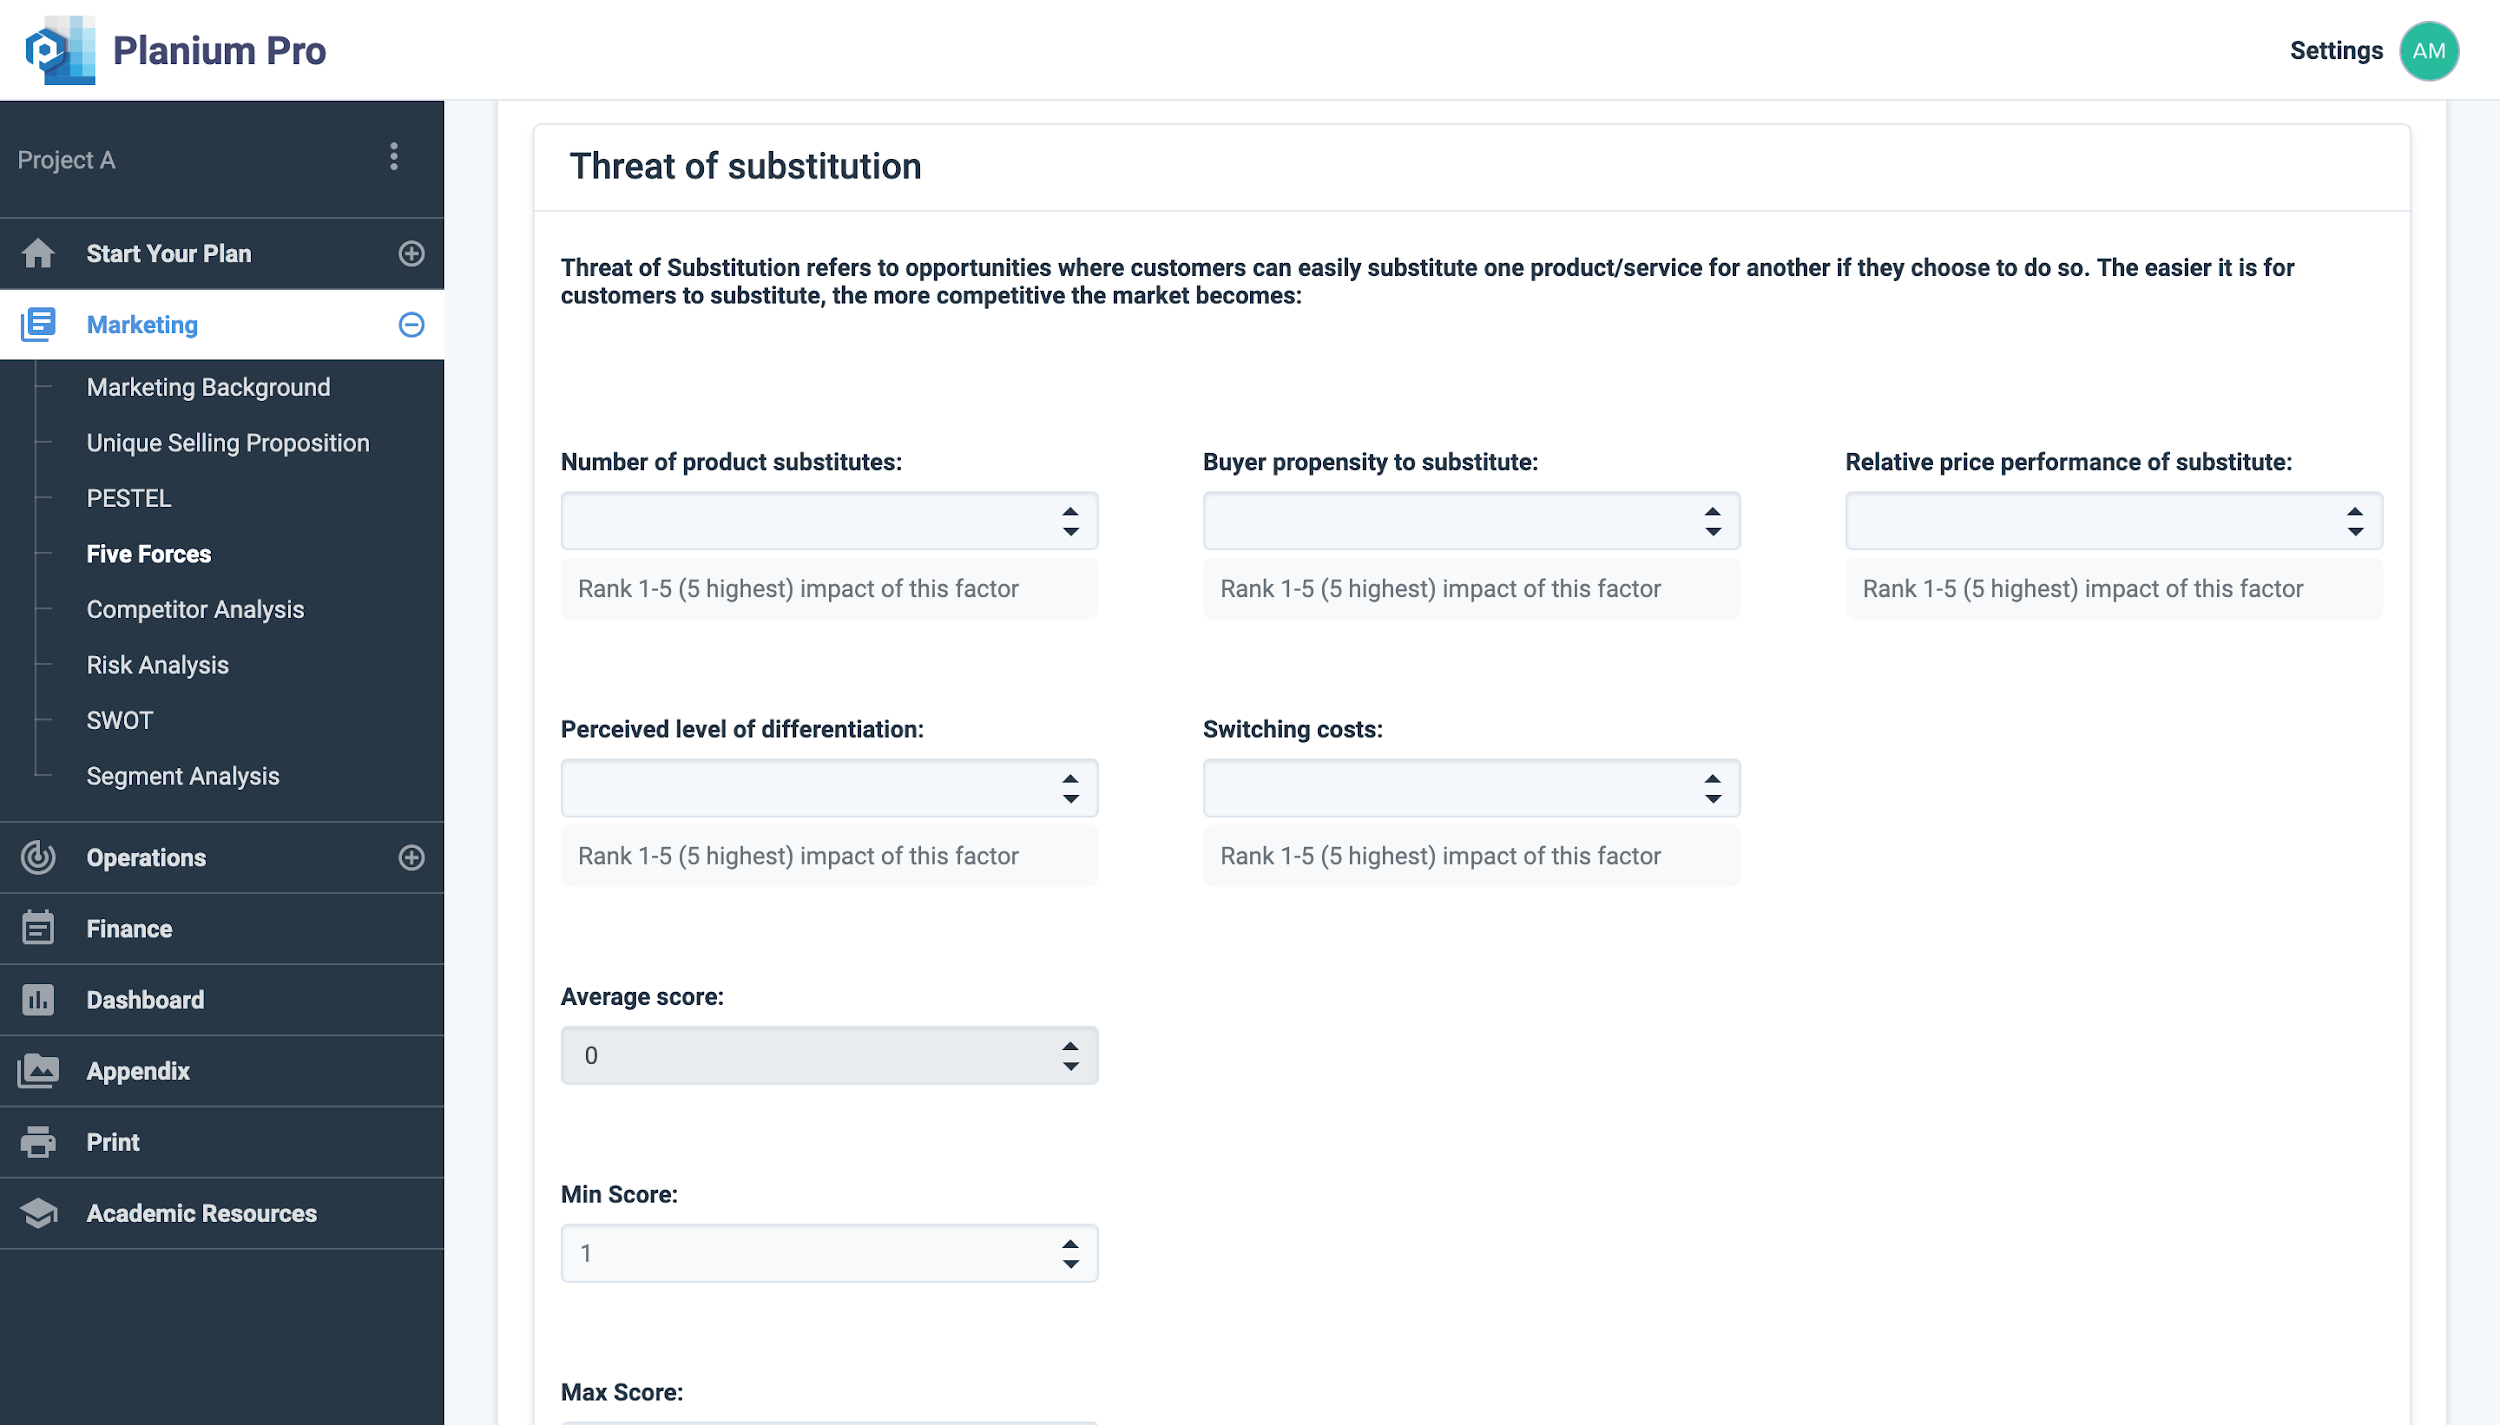
3. Threat of Substitution
This refers to how much control a supplier has over the existing market. The more power a supplier has to sell their goods at a higher cost or offer lower quality items, the lower the profit opportunity becomes. Consider the availability of substitute products or services in the industry, and how likely customers are to purchase these products or services instead of yours. An availability of viable substitutes could impact the kinds of prices that customers are willing to pay, for example.
Rank the main market on each of the criteria below, from 1 (very low) to 5 (very high).
- Available substitutes: Number of alternatives or substitutes available.
- Buyer propensity to substitute: Likelihood of buyer finding a substitute.
- Relative price performance of substitute: Price of substitutes in comparison.
- Perceived level of differentiation: Buyer understanding of quality differences.
- Switching costs: The cost to switch if a buyer is dissatisfied.
Finally, in the box add any other information applicable to Threat of Substitution.

This refers to opportunities where customers can easily substitute one product/service for another if they choose to do so. The easier it is for customers to substitute, the more competitive the market becomes. Discuss how likely it is for new competitors to enter the market, and the level of impact new entrants would have on the business. Consider how much competition already exists in your industry, and the kinds of entry barriers that new competitors face.
Rank the main market on each of the criteria below, from 1 (very low) to 5 (very high).
- Barriers to entry: Number of barriers to entry.
- Economies of scale: Number of large companies with high quantity output, low costs.
- Brand loyalty: How loyal customers are.
- Capital requirements: Need for large capital investments.
- Cumulative experience: How advanced and experienced is the market.
- Government policies: Regulatory requirements that may affect new entrants.
- Access to distribution channels: Strength of existing distribution channel relationships.
- Switching costs: The cost to switch if a buyer is dissatisfied.
Finally, in the box add any other information applicable to the Threat of New Entrants.
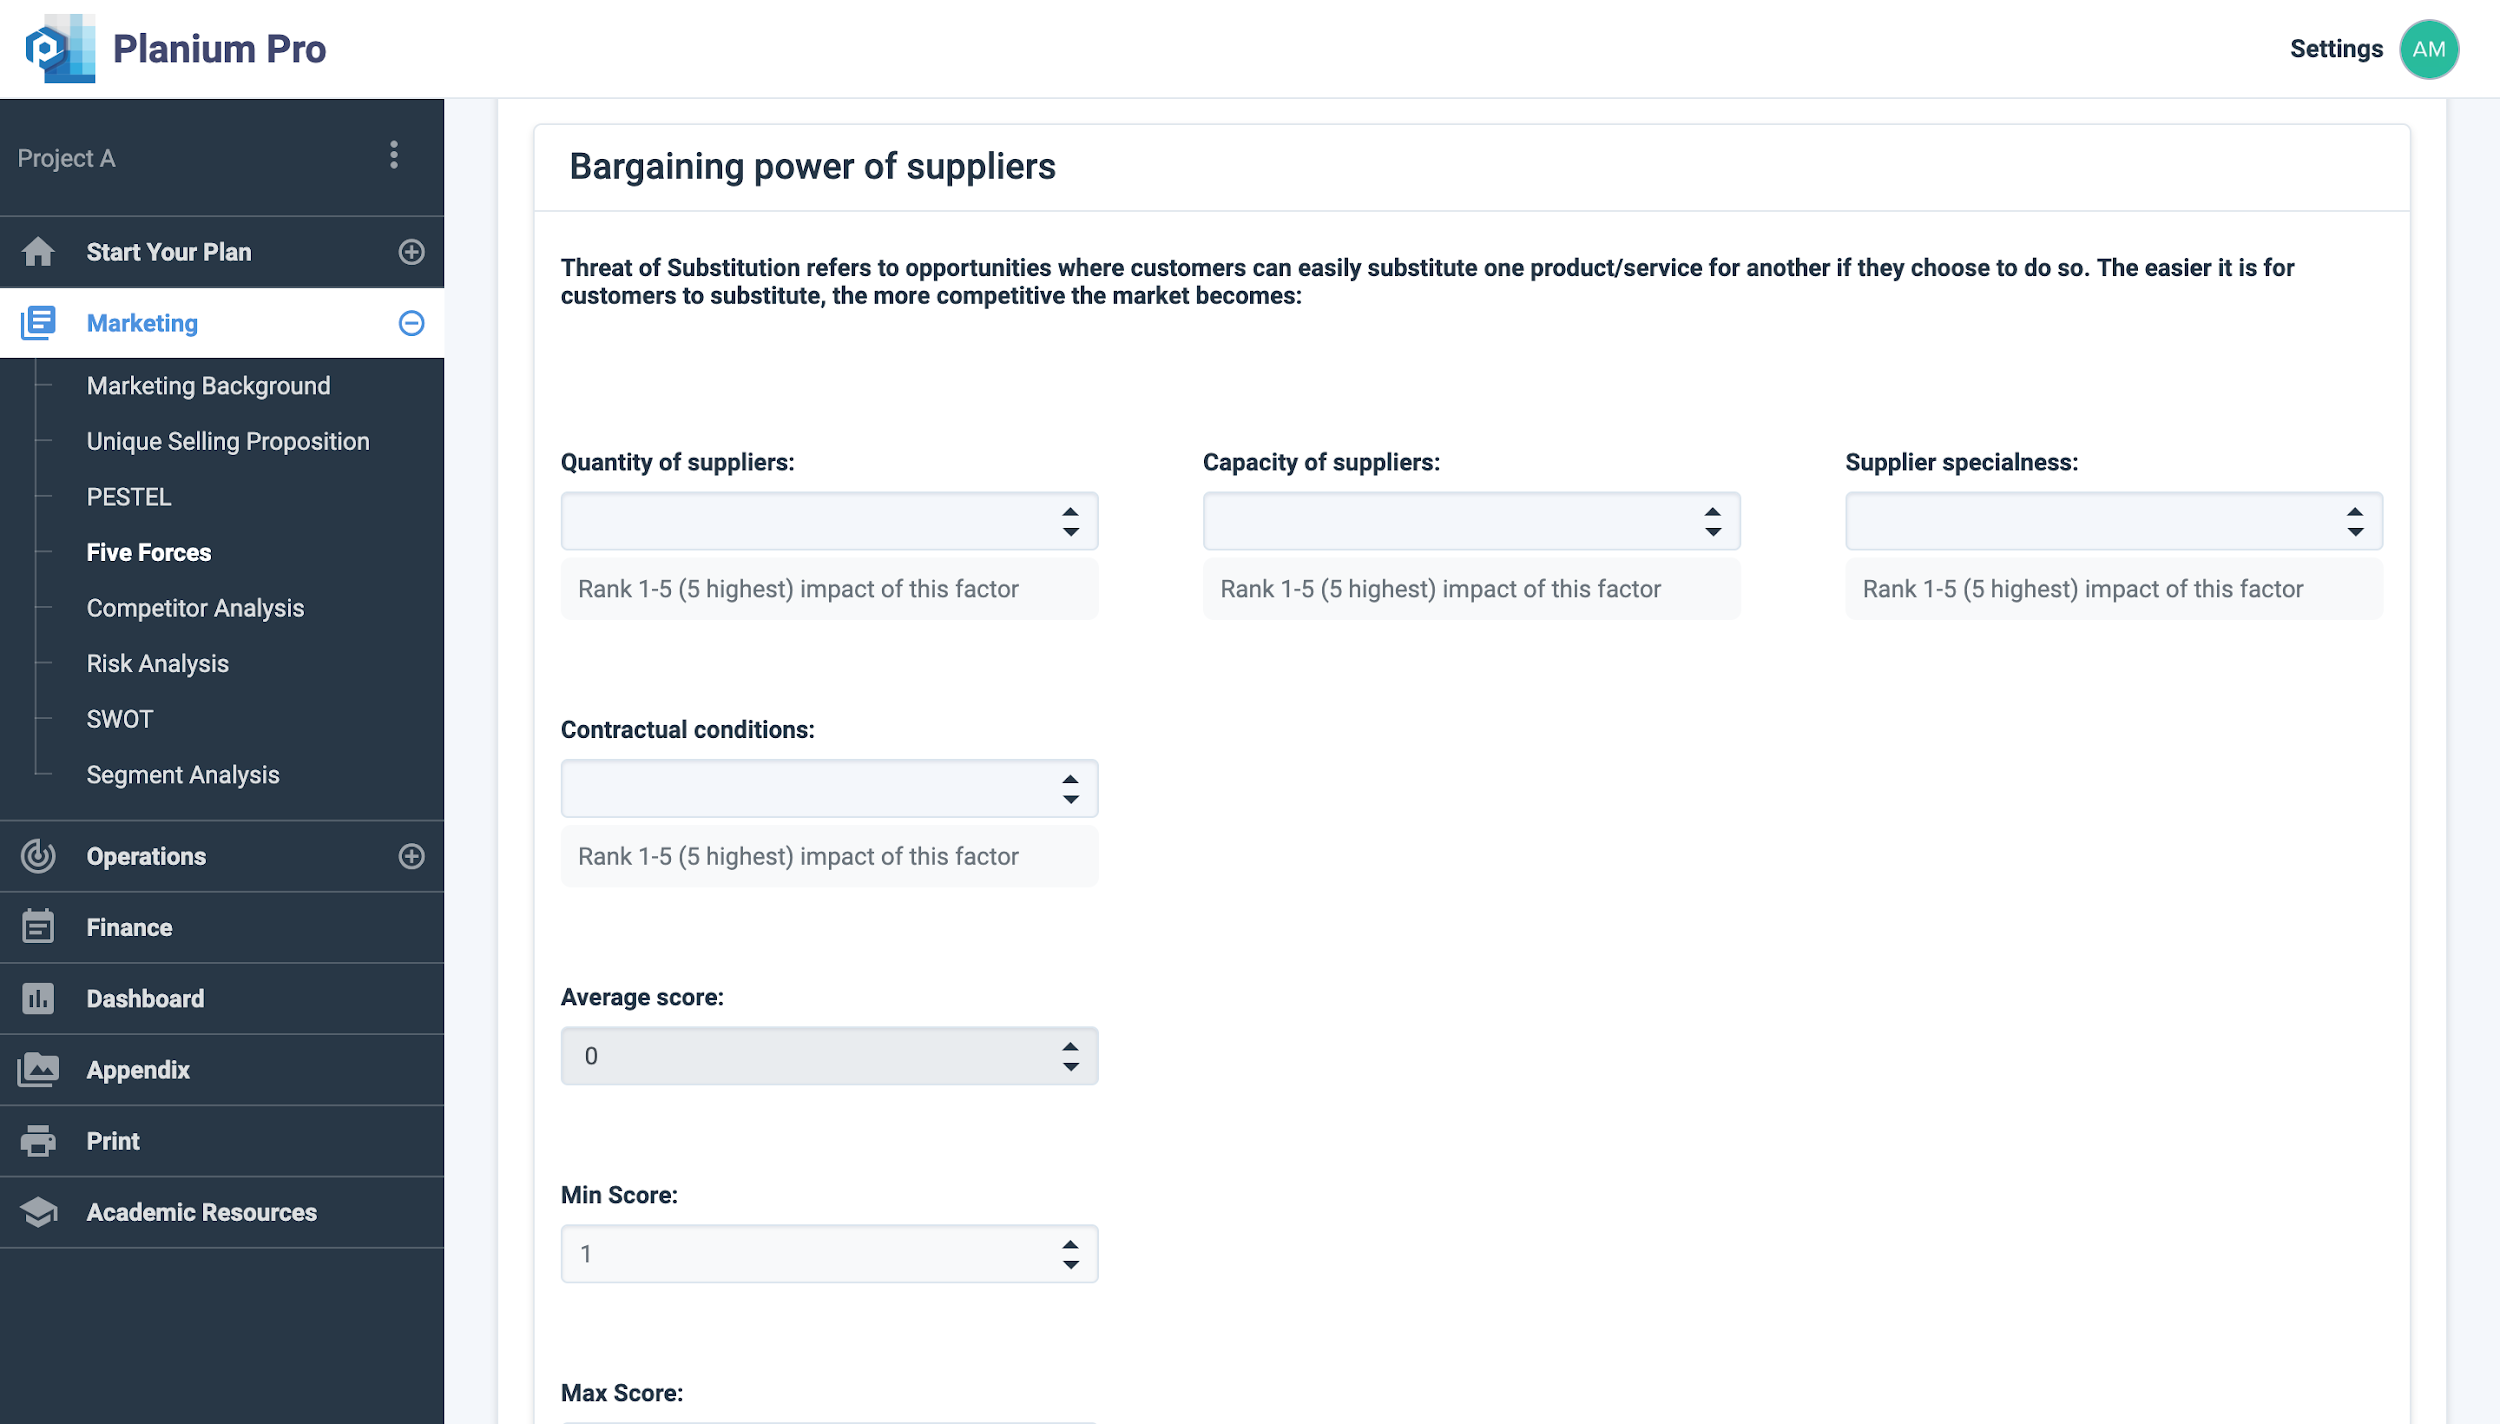
5. Bargaining Power of Suppliers
This refers to the ease of entering the market. The easier it is for other organisations to enter, the more competitive the market becomes. Detail the level of power held by suppliers in your business or project’s industry. Consider what level the business and its competitors rely on key suppliers, and whether could certain actions by these suppliers impact business operations.
Rank the main market on each of the criteria below, from 1 (very low) to 5 (very high).
- Quantity of suppliers: Number of suppliers.
- Capacity of suppliers: Specific expertise or technology needed from suppliers.
- Supplier specialness: No other suppliers available.
- Contractual conditions: Any obligations to remain with suppliers.
- Switching costs: The cost to switch if a supplier is dissatisfied.
Finally, in the box add any other information applicable to Bargaining Power of Suppliers.
Click ‘Save’ to save.
Click ‘Chart Preview’ to view the analysis results.
Analysing Five Forces Results on Planium Pro
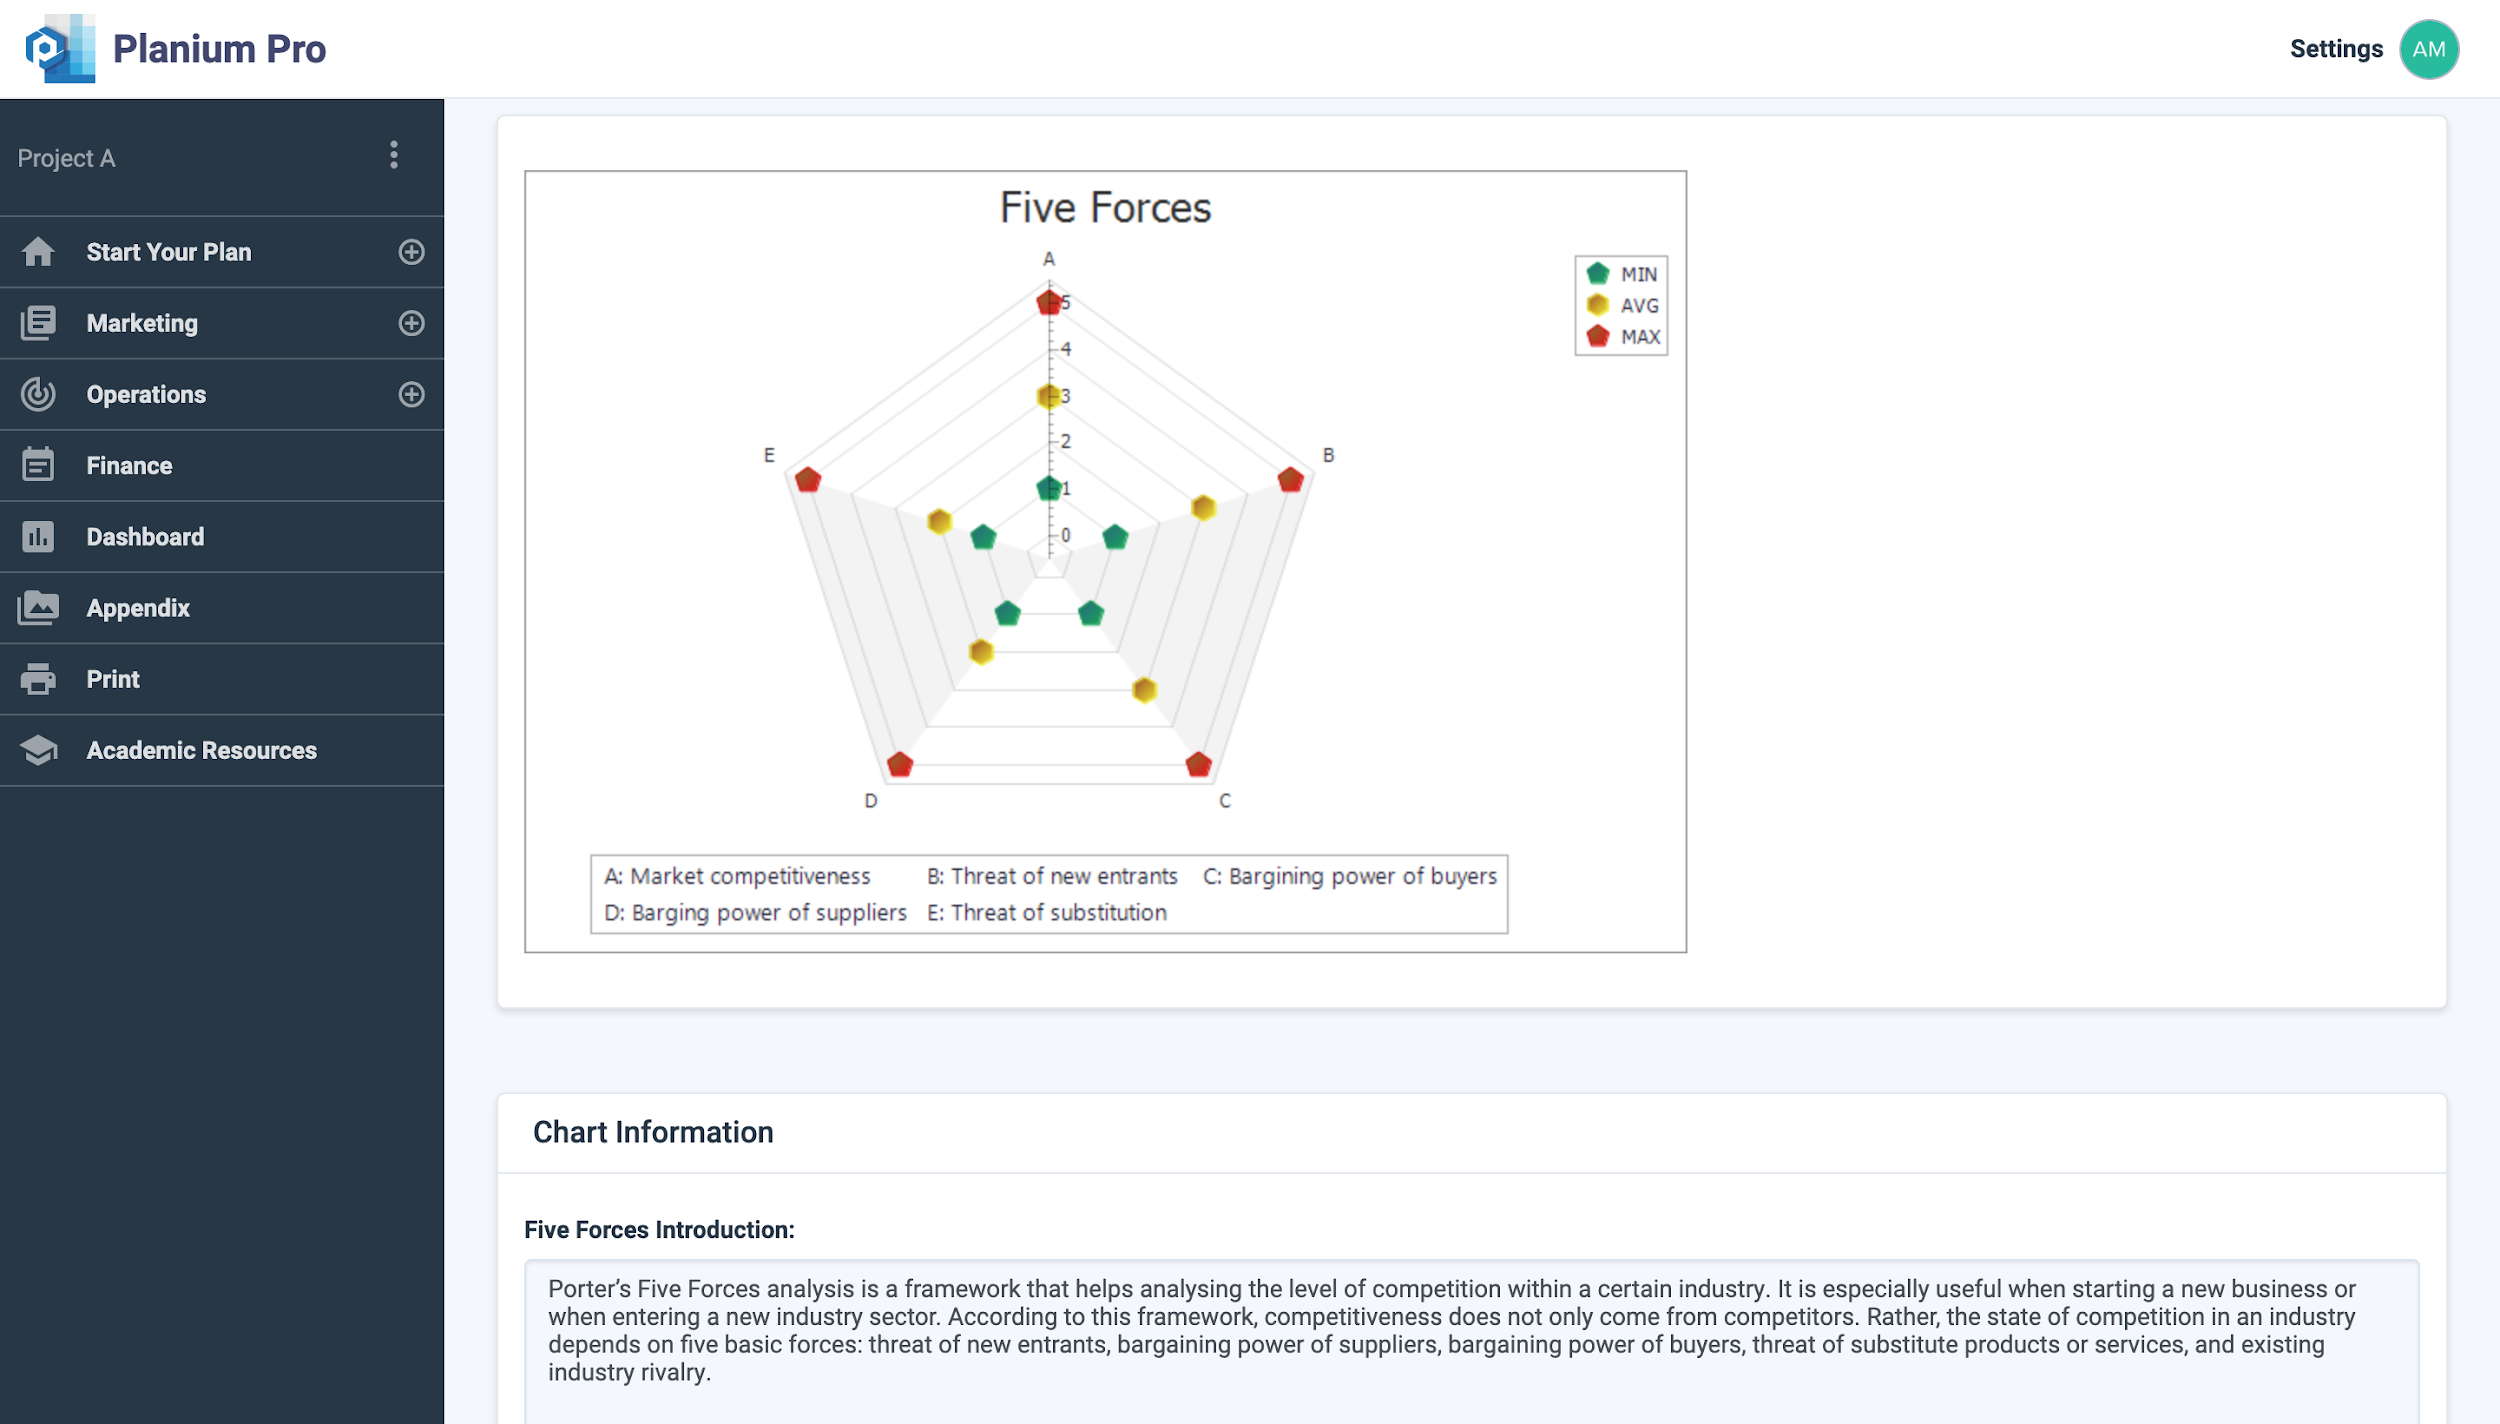
Under ‘Five Forces Introduction’, you can input any introductory information that may benefit your client or investor.
‘Analysis Results’ is the section to write-up the analysis on the graph and describe any key themes that are present in the data.
Click ‘Save’ to save.
Click ‘Report Preview’ to view the write-up in report format.
2.3.Competitor Analysis
Competitor Analysis is an evaluation of the strengths and weaknesses of the competition. They are ranked on aspects such as pricing, quality and service to assess where they fall in comparison to the proposed business, and other competitors. This process will also help to determine the business’ competitive advantage.
Using Competitor Analysis on Planium Pro
To complete section, on the left-hand side menu bar, click the + to expand the ‘Marketing’ menu and select ‘Competitor Analysis’.
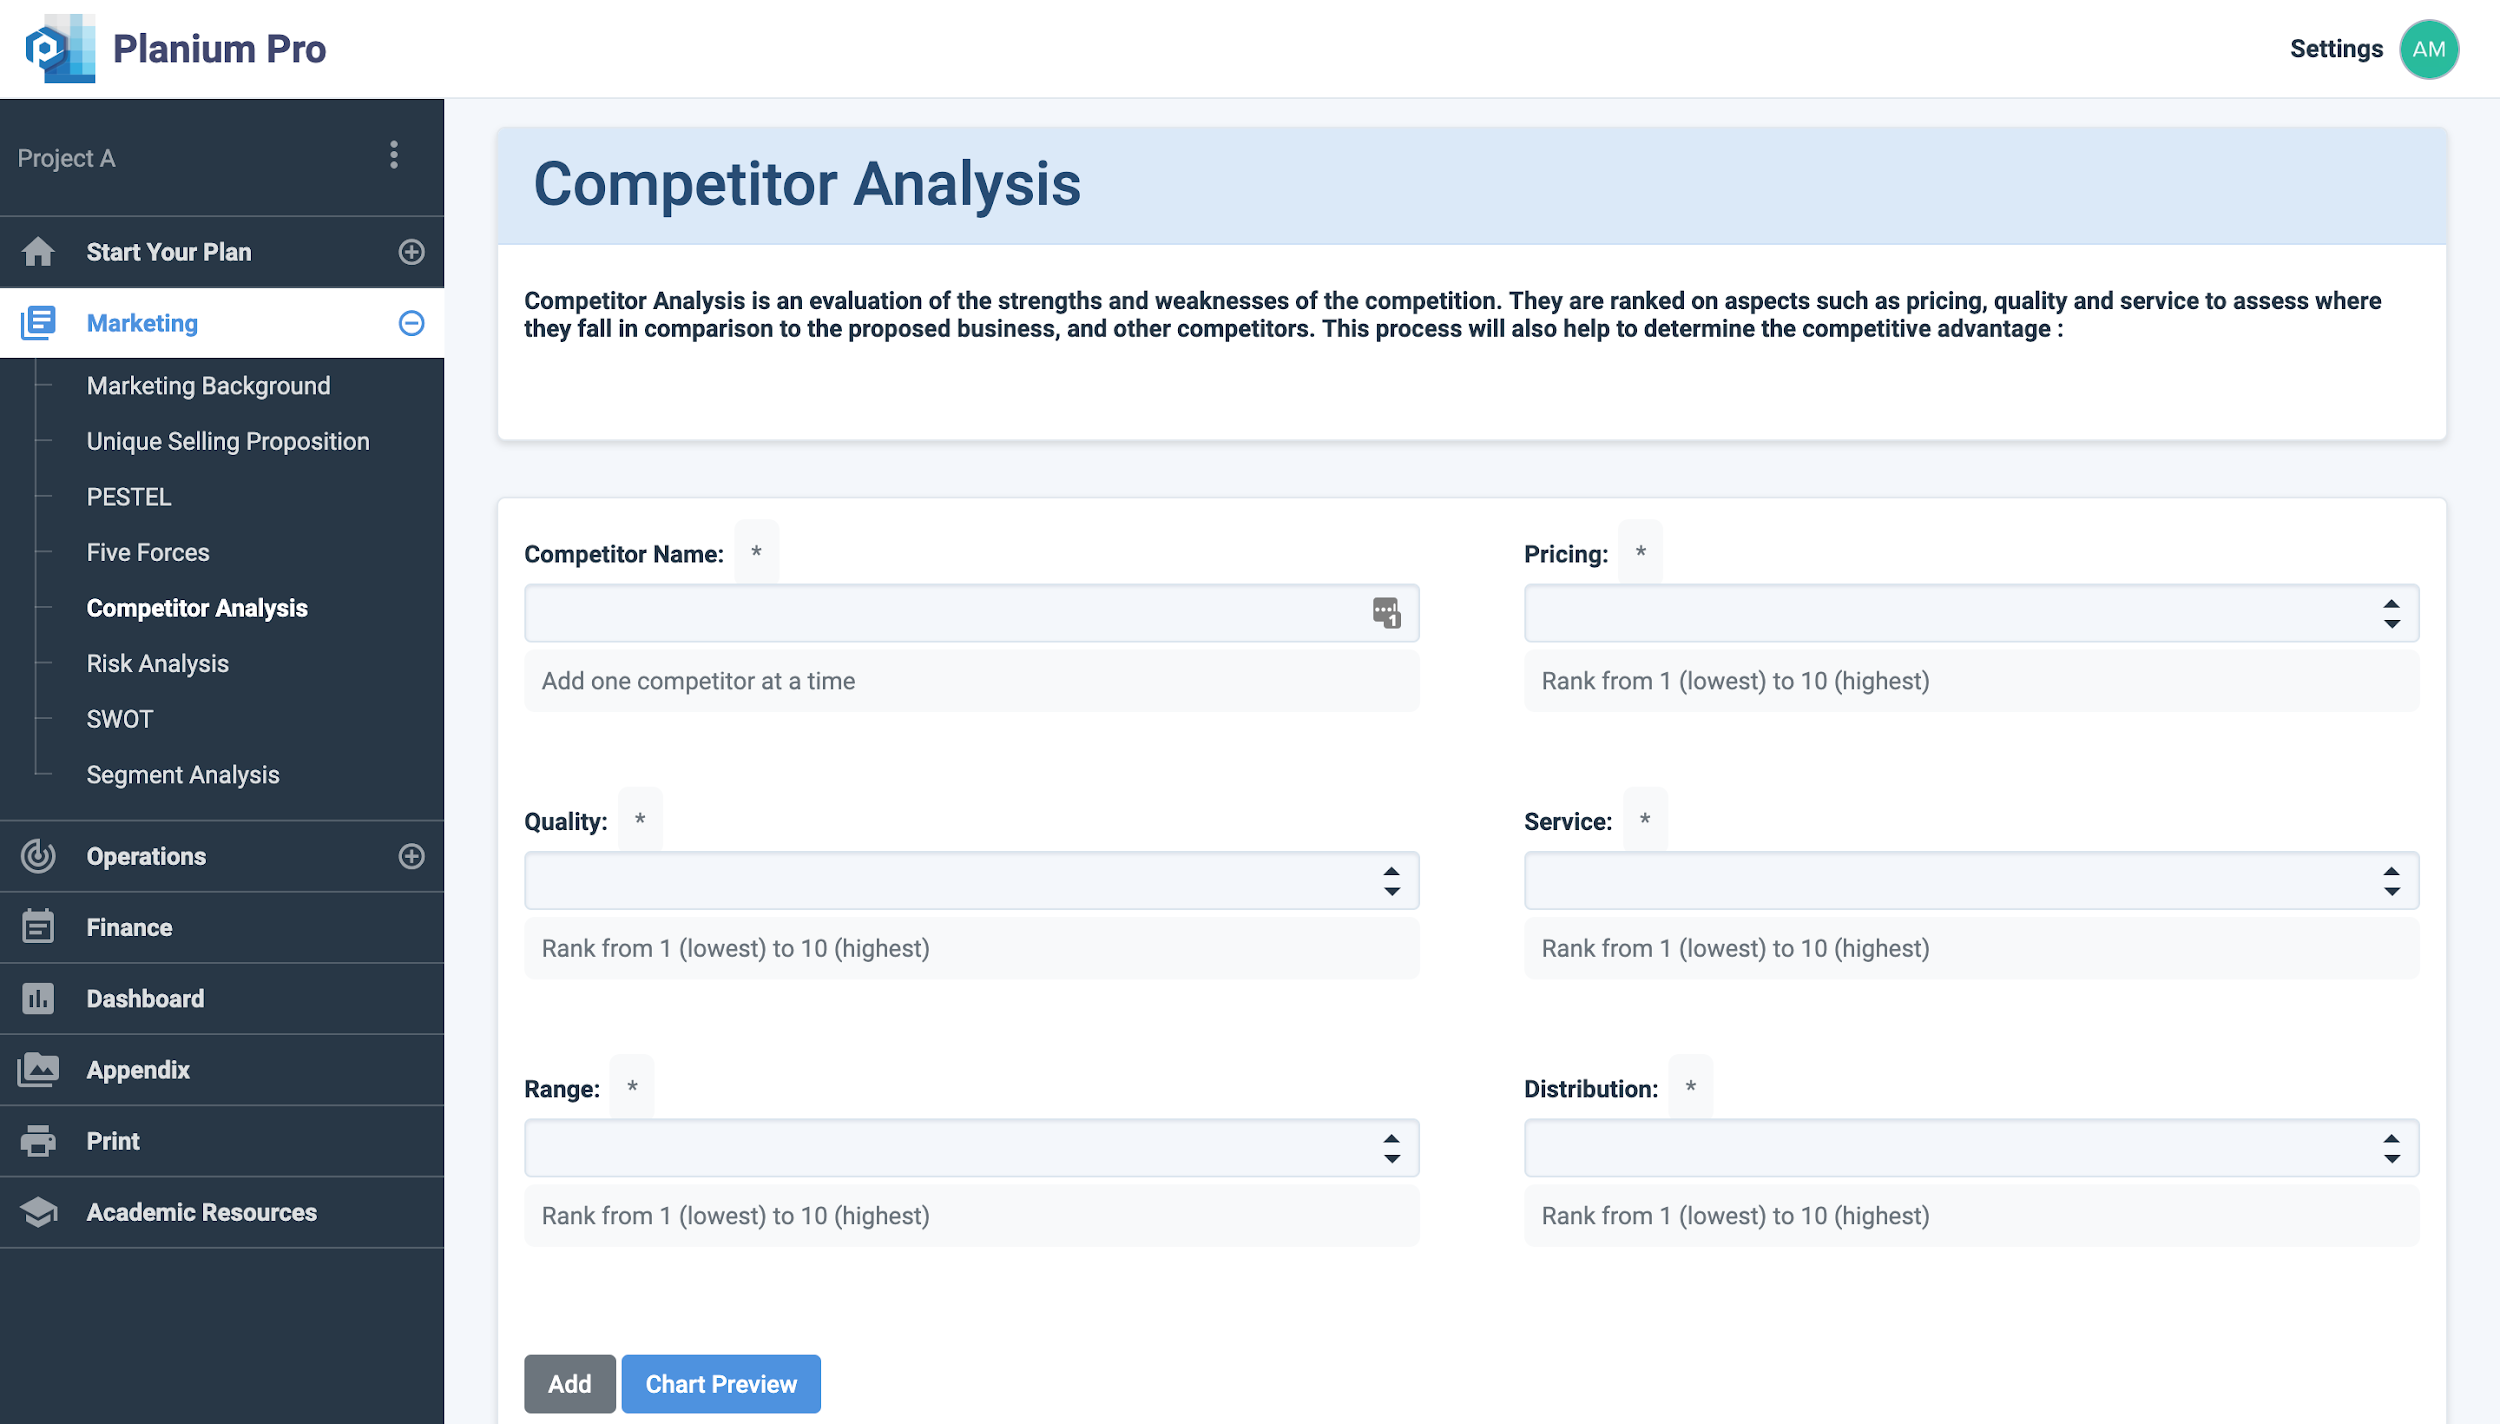
Add one competitor at a time, and allocate a number on the following fields:
- Pricing: Rank the competitor’s pricing from 1 (being the lowest) to 10 (being the highest)
- Quality: Rank the competitor’s quality from 1 (lowest) to 10 (highest)
- Service: Rank the competitor’s service from 1 (lowest) to 10 (highest)
- Range: Rank the competitor’s range from 1 (smallest) to 10 (largest)
- Distribution: Rank the competitor’s distribution from 1 (smallest) to 10 (largest)
Click ‘Add’ to save changes.
Click ‘Chart Preview’ to view the analysis results.
Analysing Competitor Analysis Results on Planium Pro
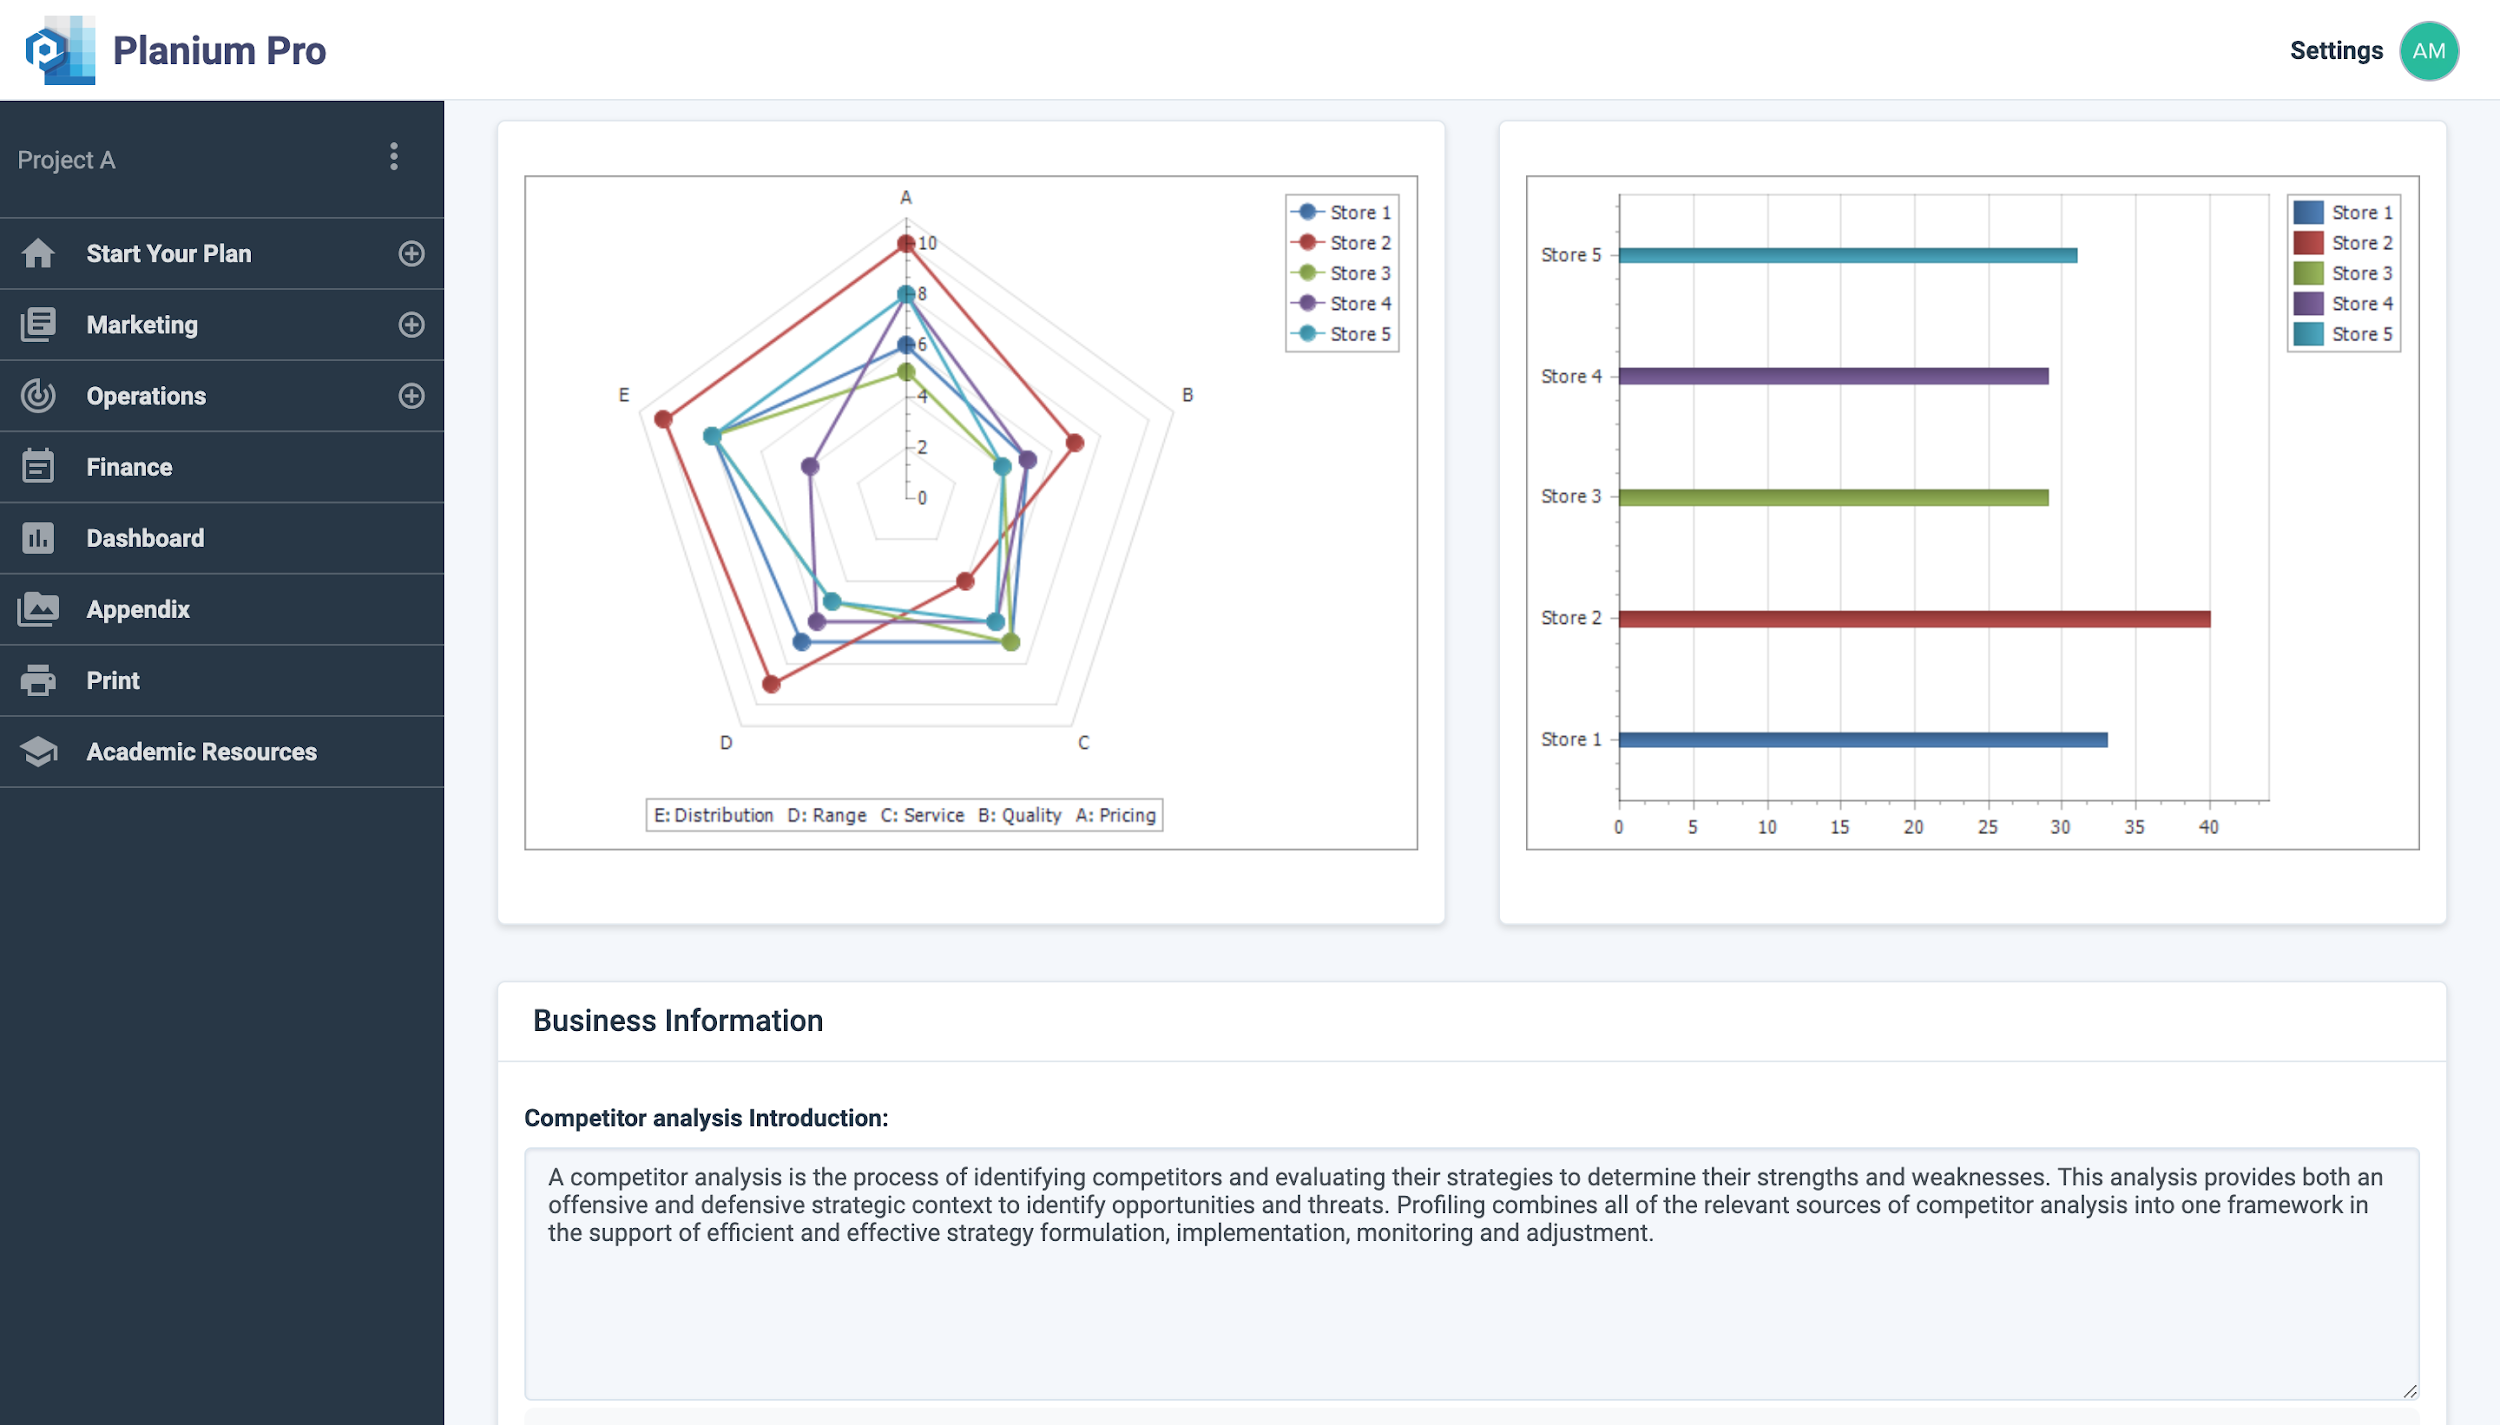
Under ‘Competitor Analysis Introduction’, you can input any introductory information that may benefit your client or investor.
‘Analysis Results’ is the section to write-up the analysis on the graph and describe any key themes that are present in the data.
Click ‘Save’ to save changes.
Click ‘Report Preview’ to view the write-up in report format.
2.4.Risk Analysis
Risk Analysis
Managing risk is important for all businesses, no matter the size. There are different types of risk with different degrees that can impact the organisation’s performance. Risk analysis is the process of identification, response planning, mitigation and management. The objectives of risk mitigation are to increase the likelihood and impact of positive events and decrease the likelihood and impact of negative events in the project.

Using Risk Analysis on Planium Pro
To complete this section, on the left-hand side menu bar, click the + to expand the ‘Marketing’ menu and select ‘Risk Analysis’. Use the explanations below to complete the information in the corresponding fields.
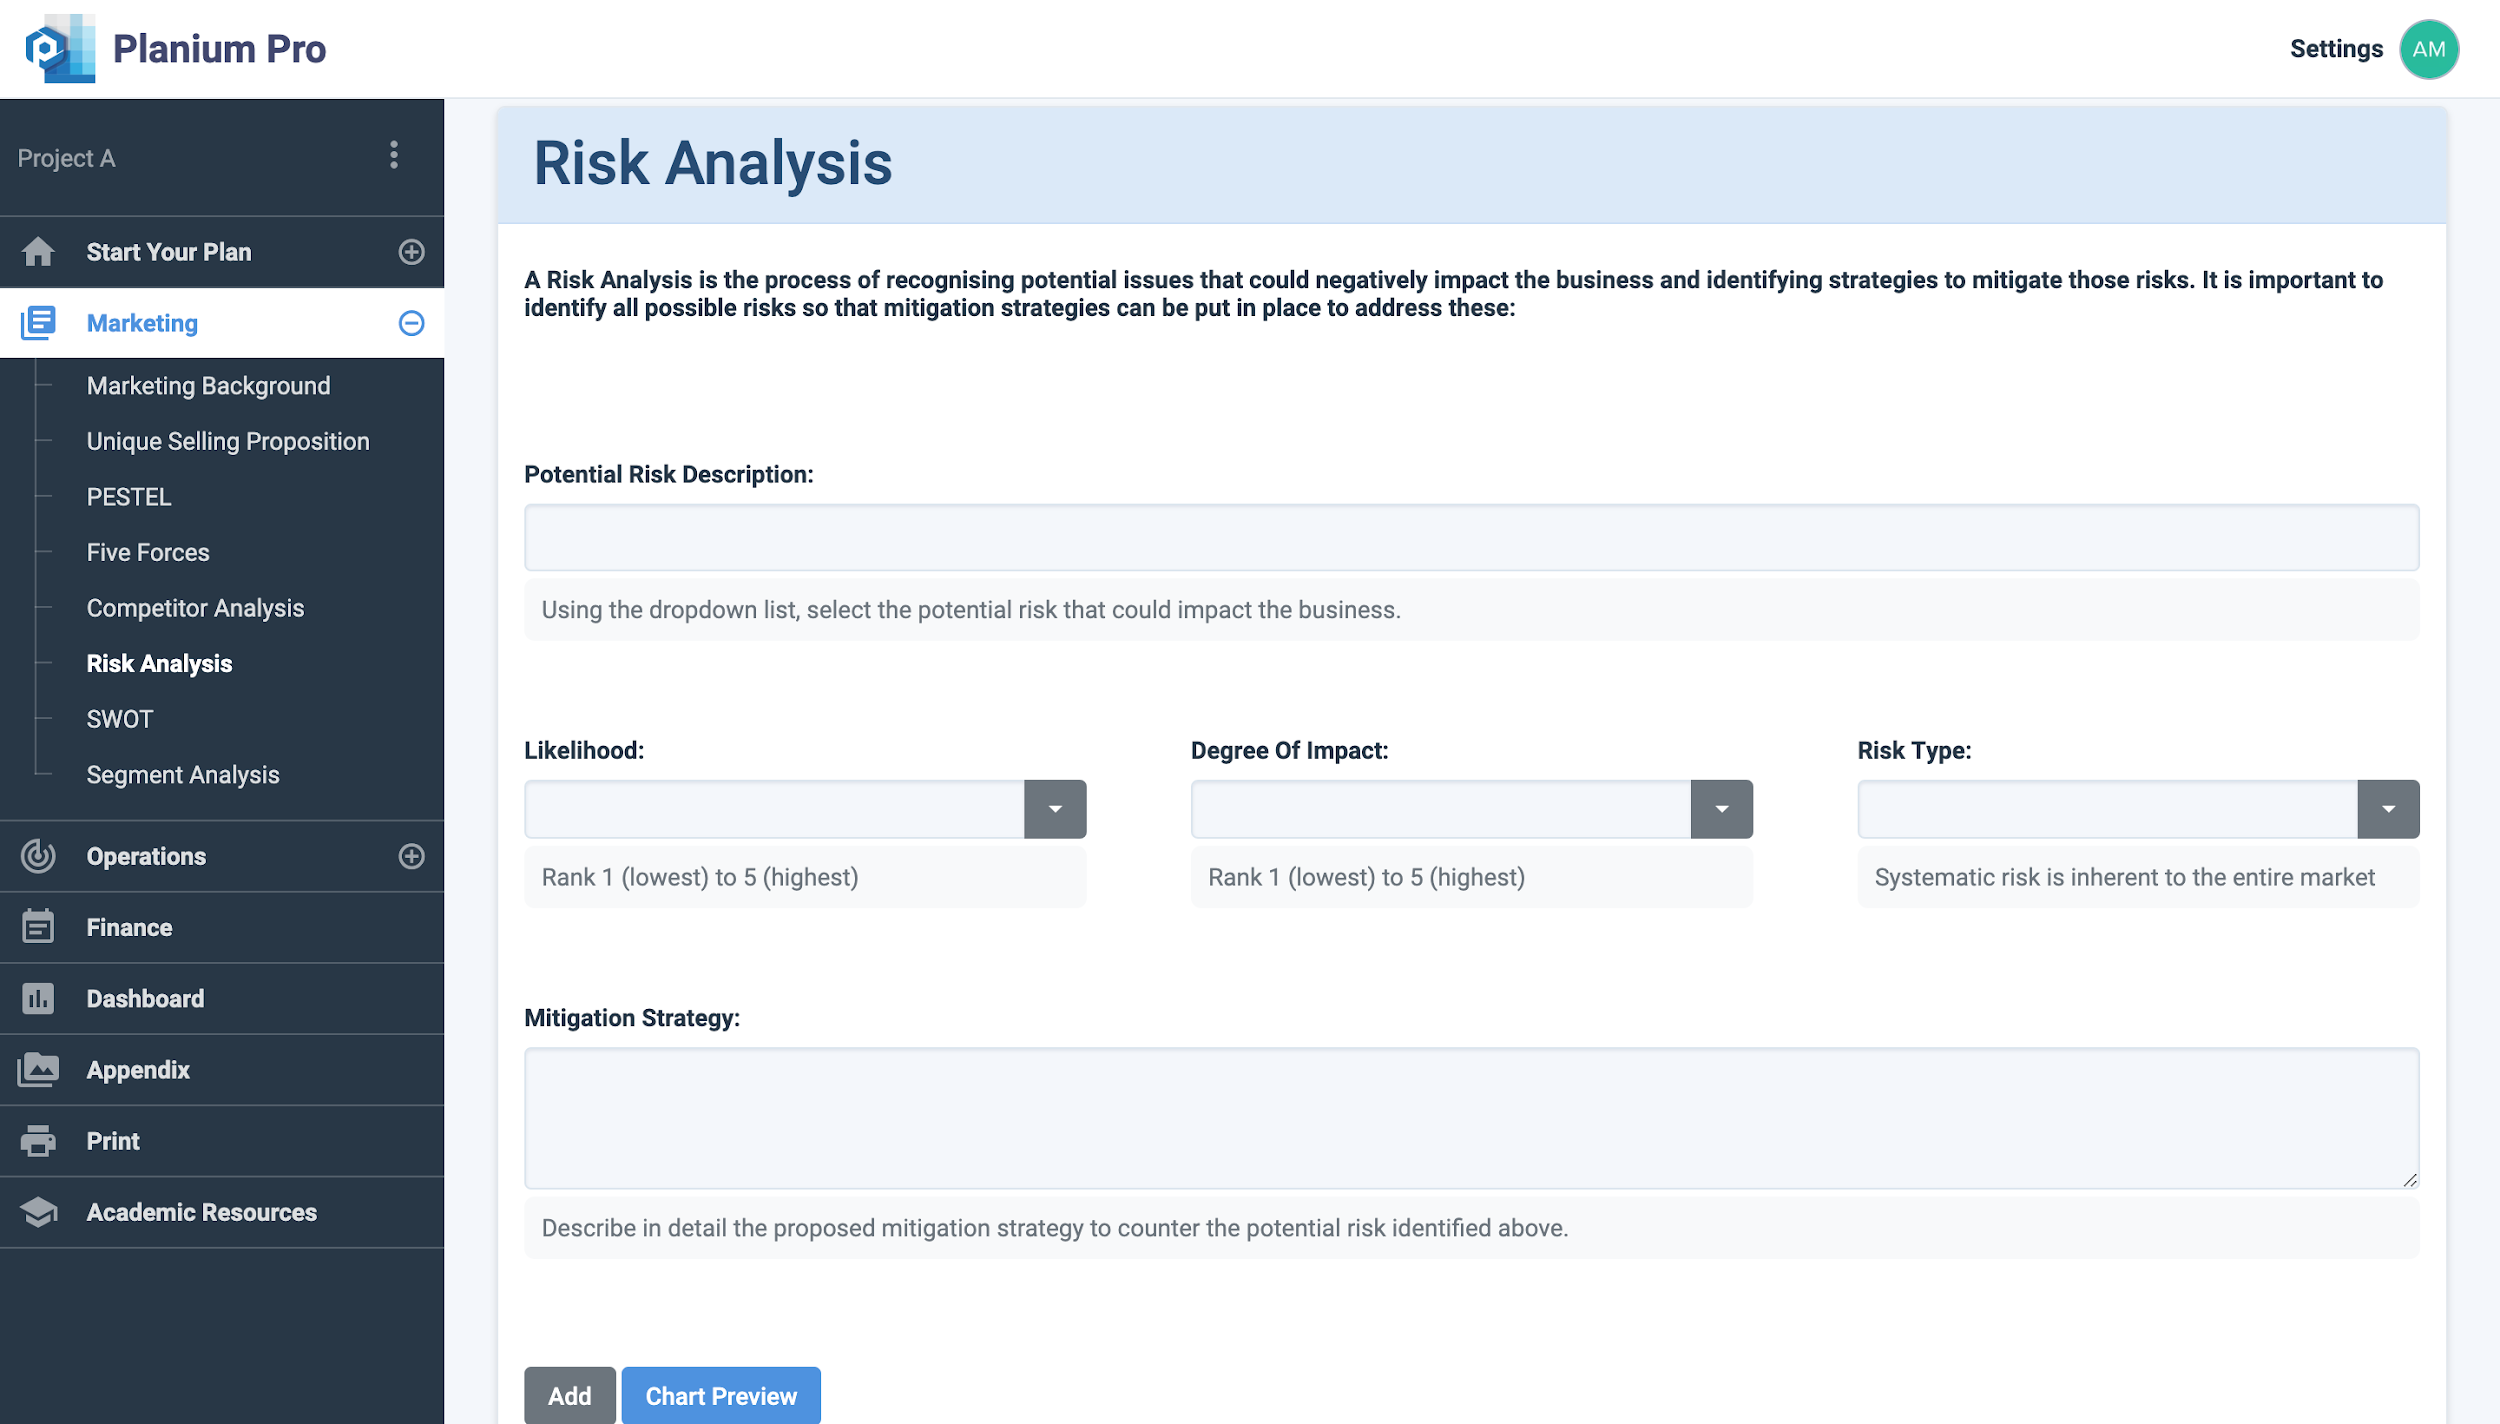
Potential Risk Description:
A dropdown menu will appear when this field is clicked. Below are the types of risks. Select one relevant risk at a time to assess.
Likelihood:
Rank the likelihood the risk will occur from 1 (lowest possible chance of occuring) to 5 (highest possible chance of occuring).
Degree of Impact:
Rank the degree of impact the risk holds from 1 (lowest possible impact) to 5 (highest possible impact).
Type of Risk:
- Systematic (non-diversifiable) risk concerns factors that affect the whole market and generally cannot be avoided. These are on the national and international scale, such as inflation, changes to international relations, or war.
- Non-systematic (diversifiable) risk relates to factors that affect one or a small number of firms, such as a workers’ strike, legal proceedings, or change of management. This can generally be mitigated by diversifying.
Mitigation Strategy:
State how the business or project will overcome or avoid the given risk.
Click ‘Add’ to save changes.
Click ‘Chart Preview’ to view the analysis results.
Analysing Risk Analysis Results on Planium Pro
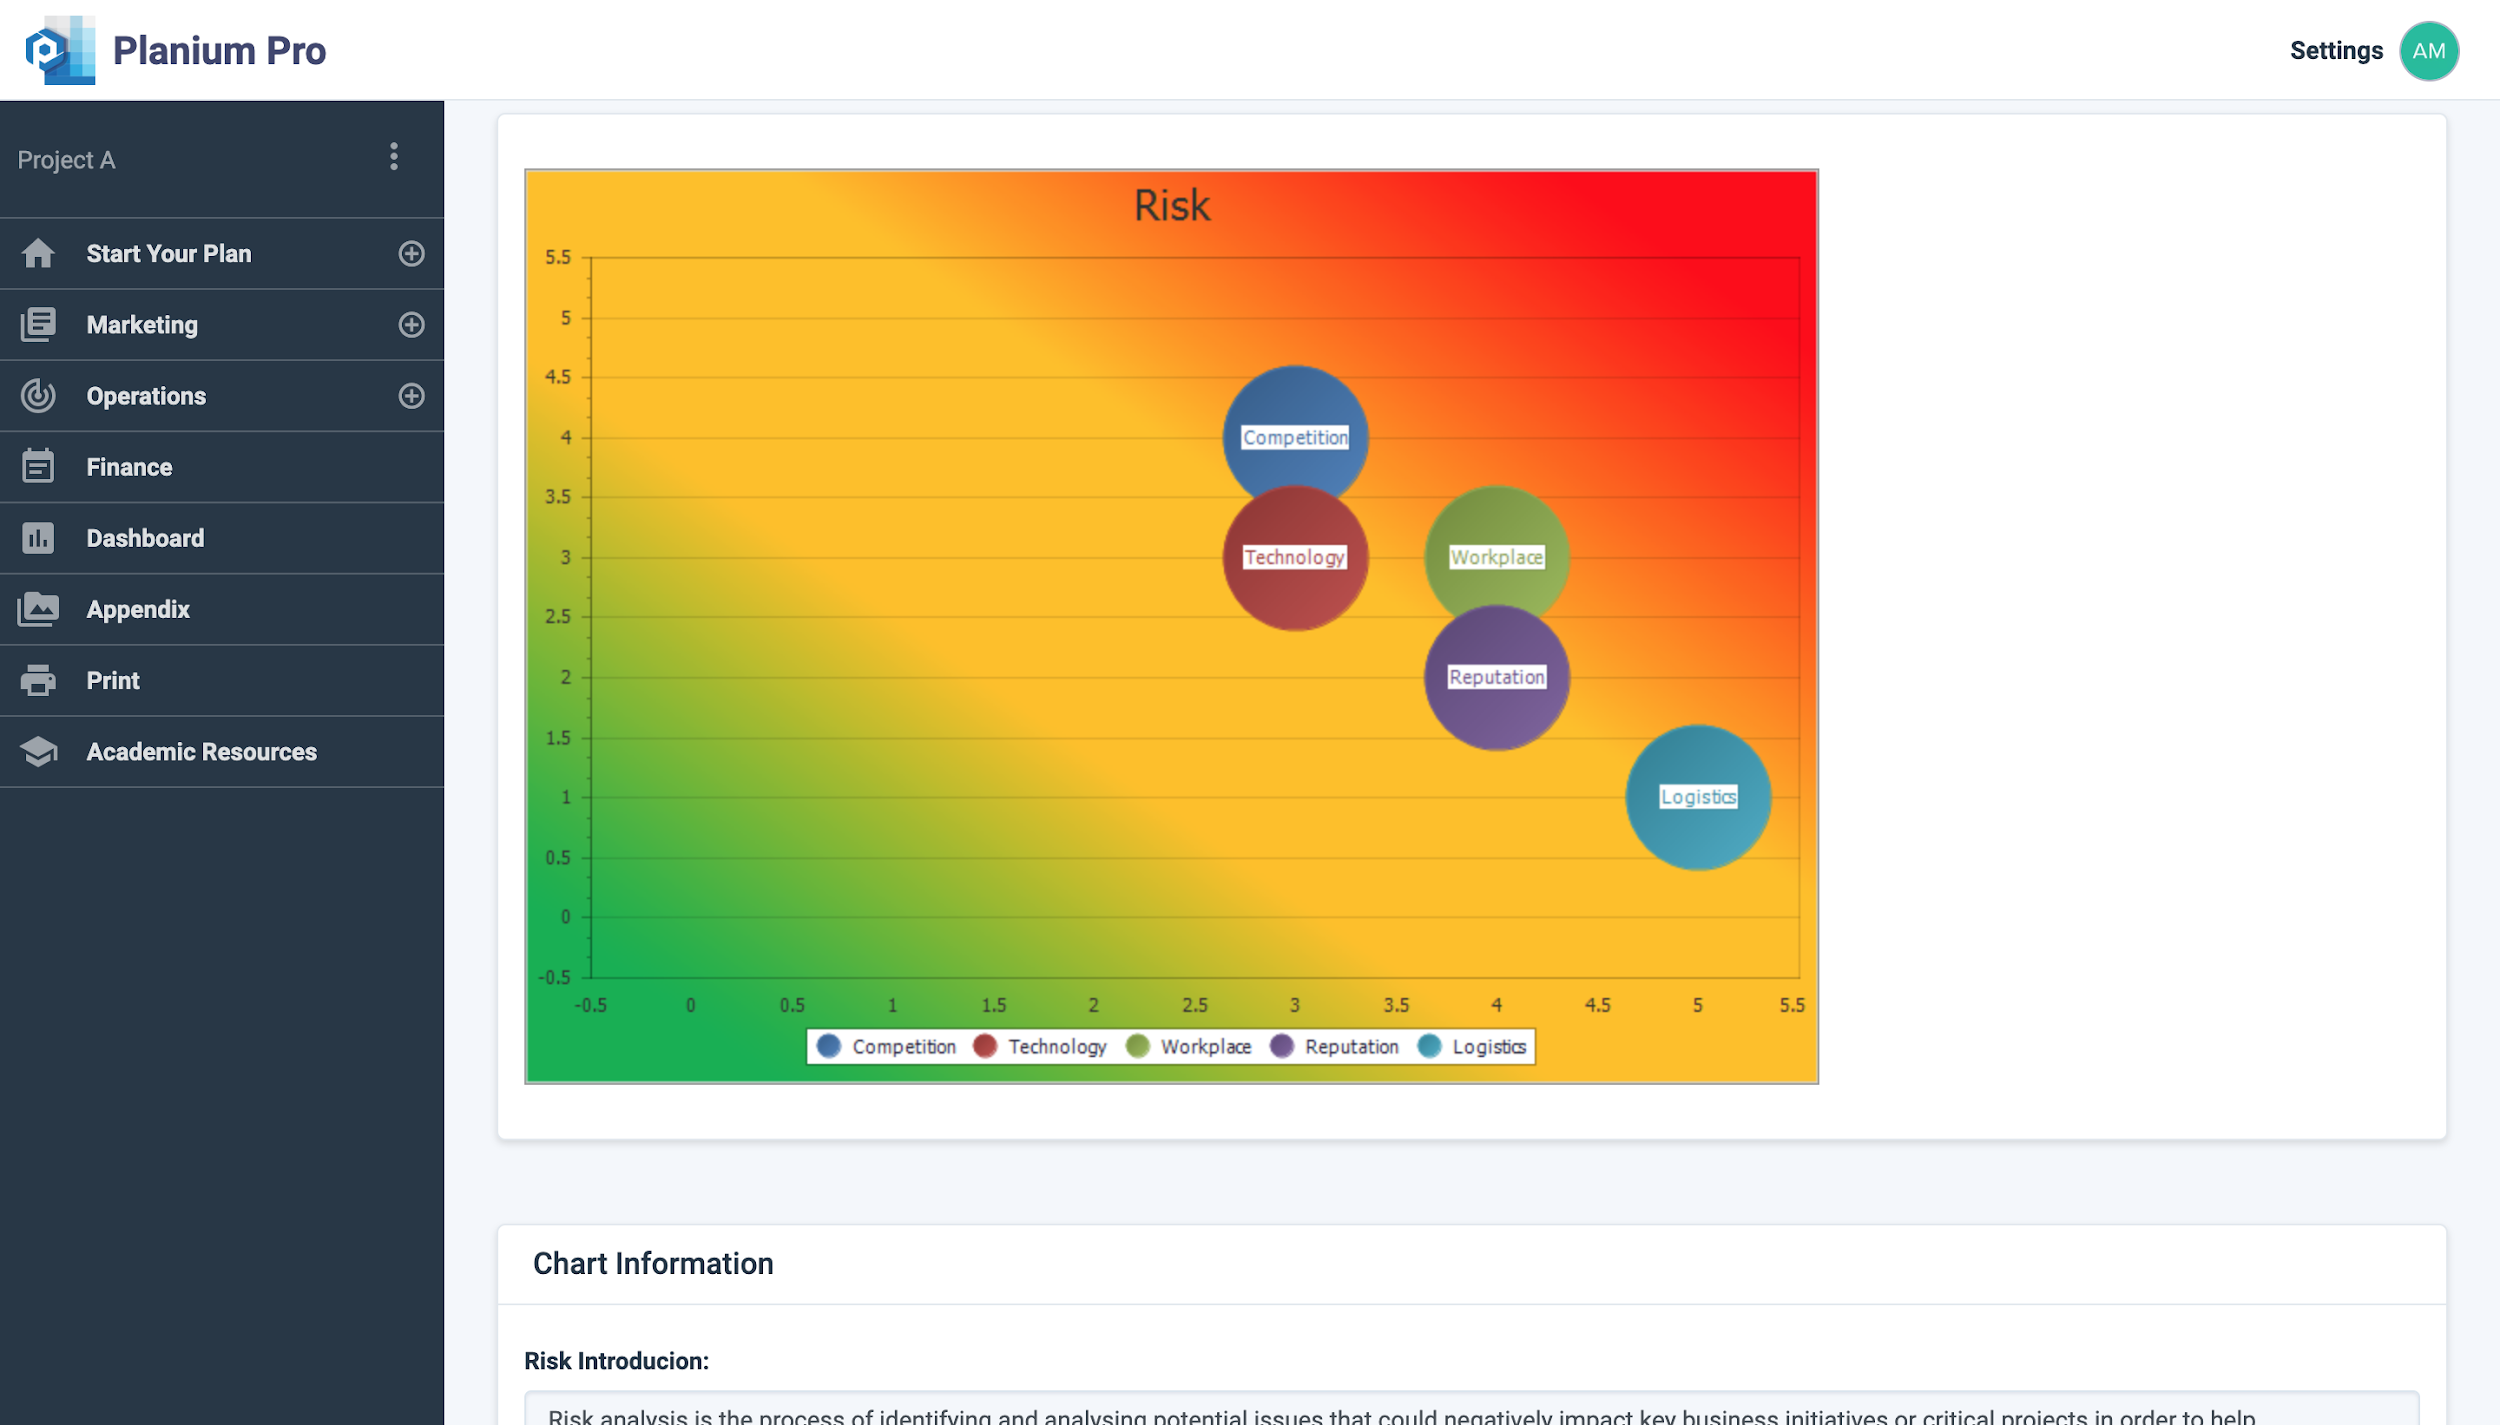
Under ‘Risk Analysis Introduction’, you can input any introductory information that may benefit your client or investor.
‘Analysis Results’ is the section to write-up the analysis on the graph and describe any key themes that are present in the data.
Click ‘Save’ to save changes.
Click ‘Report Preview’ to view the write-up in report format.
2.5.SWOT Analysis
SWOT Analysis
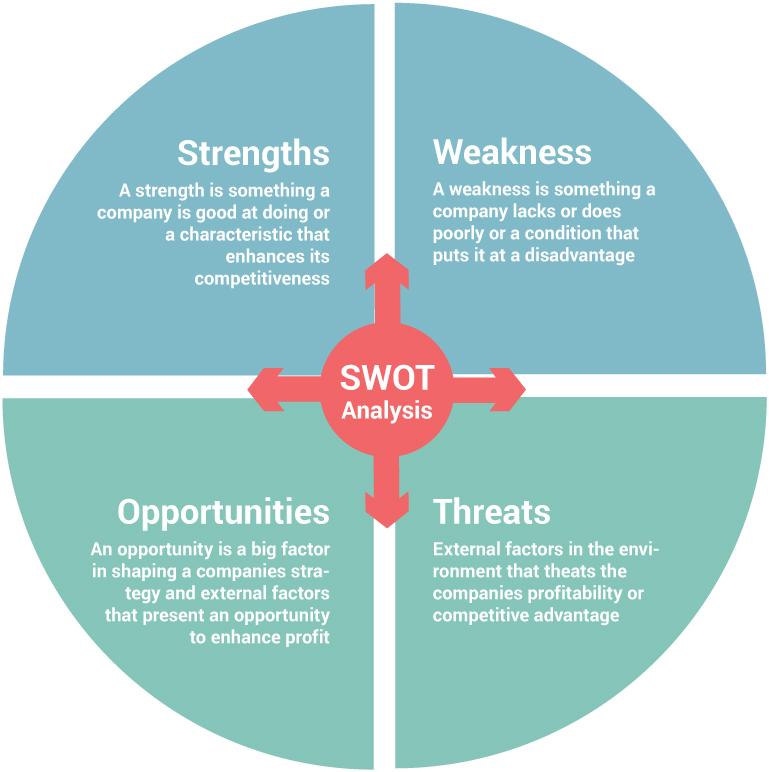
SWOT Analysis was originally developed by Albert Humphrey in the 1960s, and has become a common and useful technique for identifying a business’ internal factors (e.g. strengths and weaknesses) and its external factors (e.g. opportunities and threats).
There are many benefits of SWOT analysis:
- It is low cost to conduct
- It helps to understand your business and competitors
- Provides useful critical information that can be used for forecasting; helps decision makers address weaknesses and threats and capitalise on strengths and opportunities.
It is important to note that this technique can help to identify and understand key issues affecting the organisation, but it does not offer solutions as it is subjective, and the data used in the analysis may be based on unreliable assumptions. Regardless of the limitation, the benefits outweigh the limitations.
Using SWOT Analysis on Planium Pro
To complete this section, on the left-hand side menu bar, click the + to expand the ‘Marketing’ menu and select ‘SWOT’. To add a new factor, click on ‘New’ in the top left corner of each table. When an empty field appears, add in the factor and rank it on:
- Scope: the range of impact
- Significance: the degree of impact
- Strategic Influence: the influence within the business
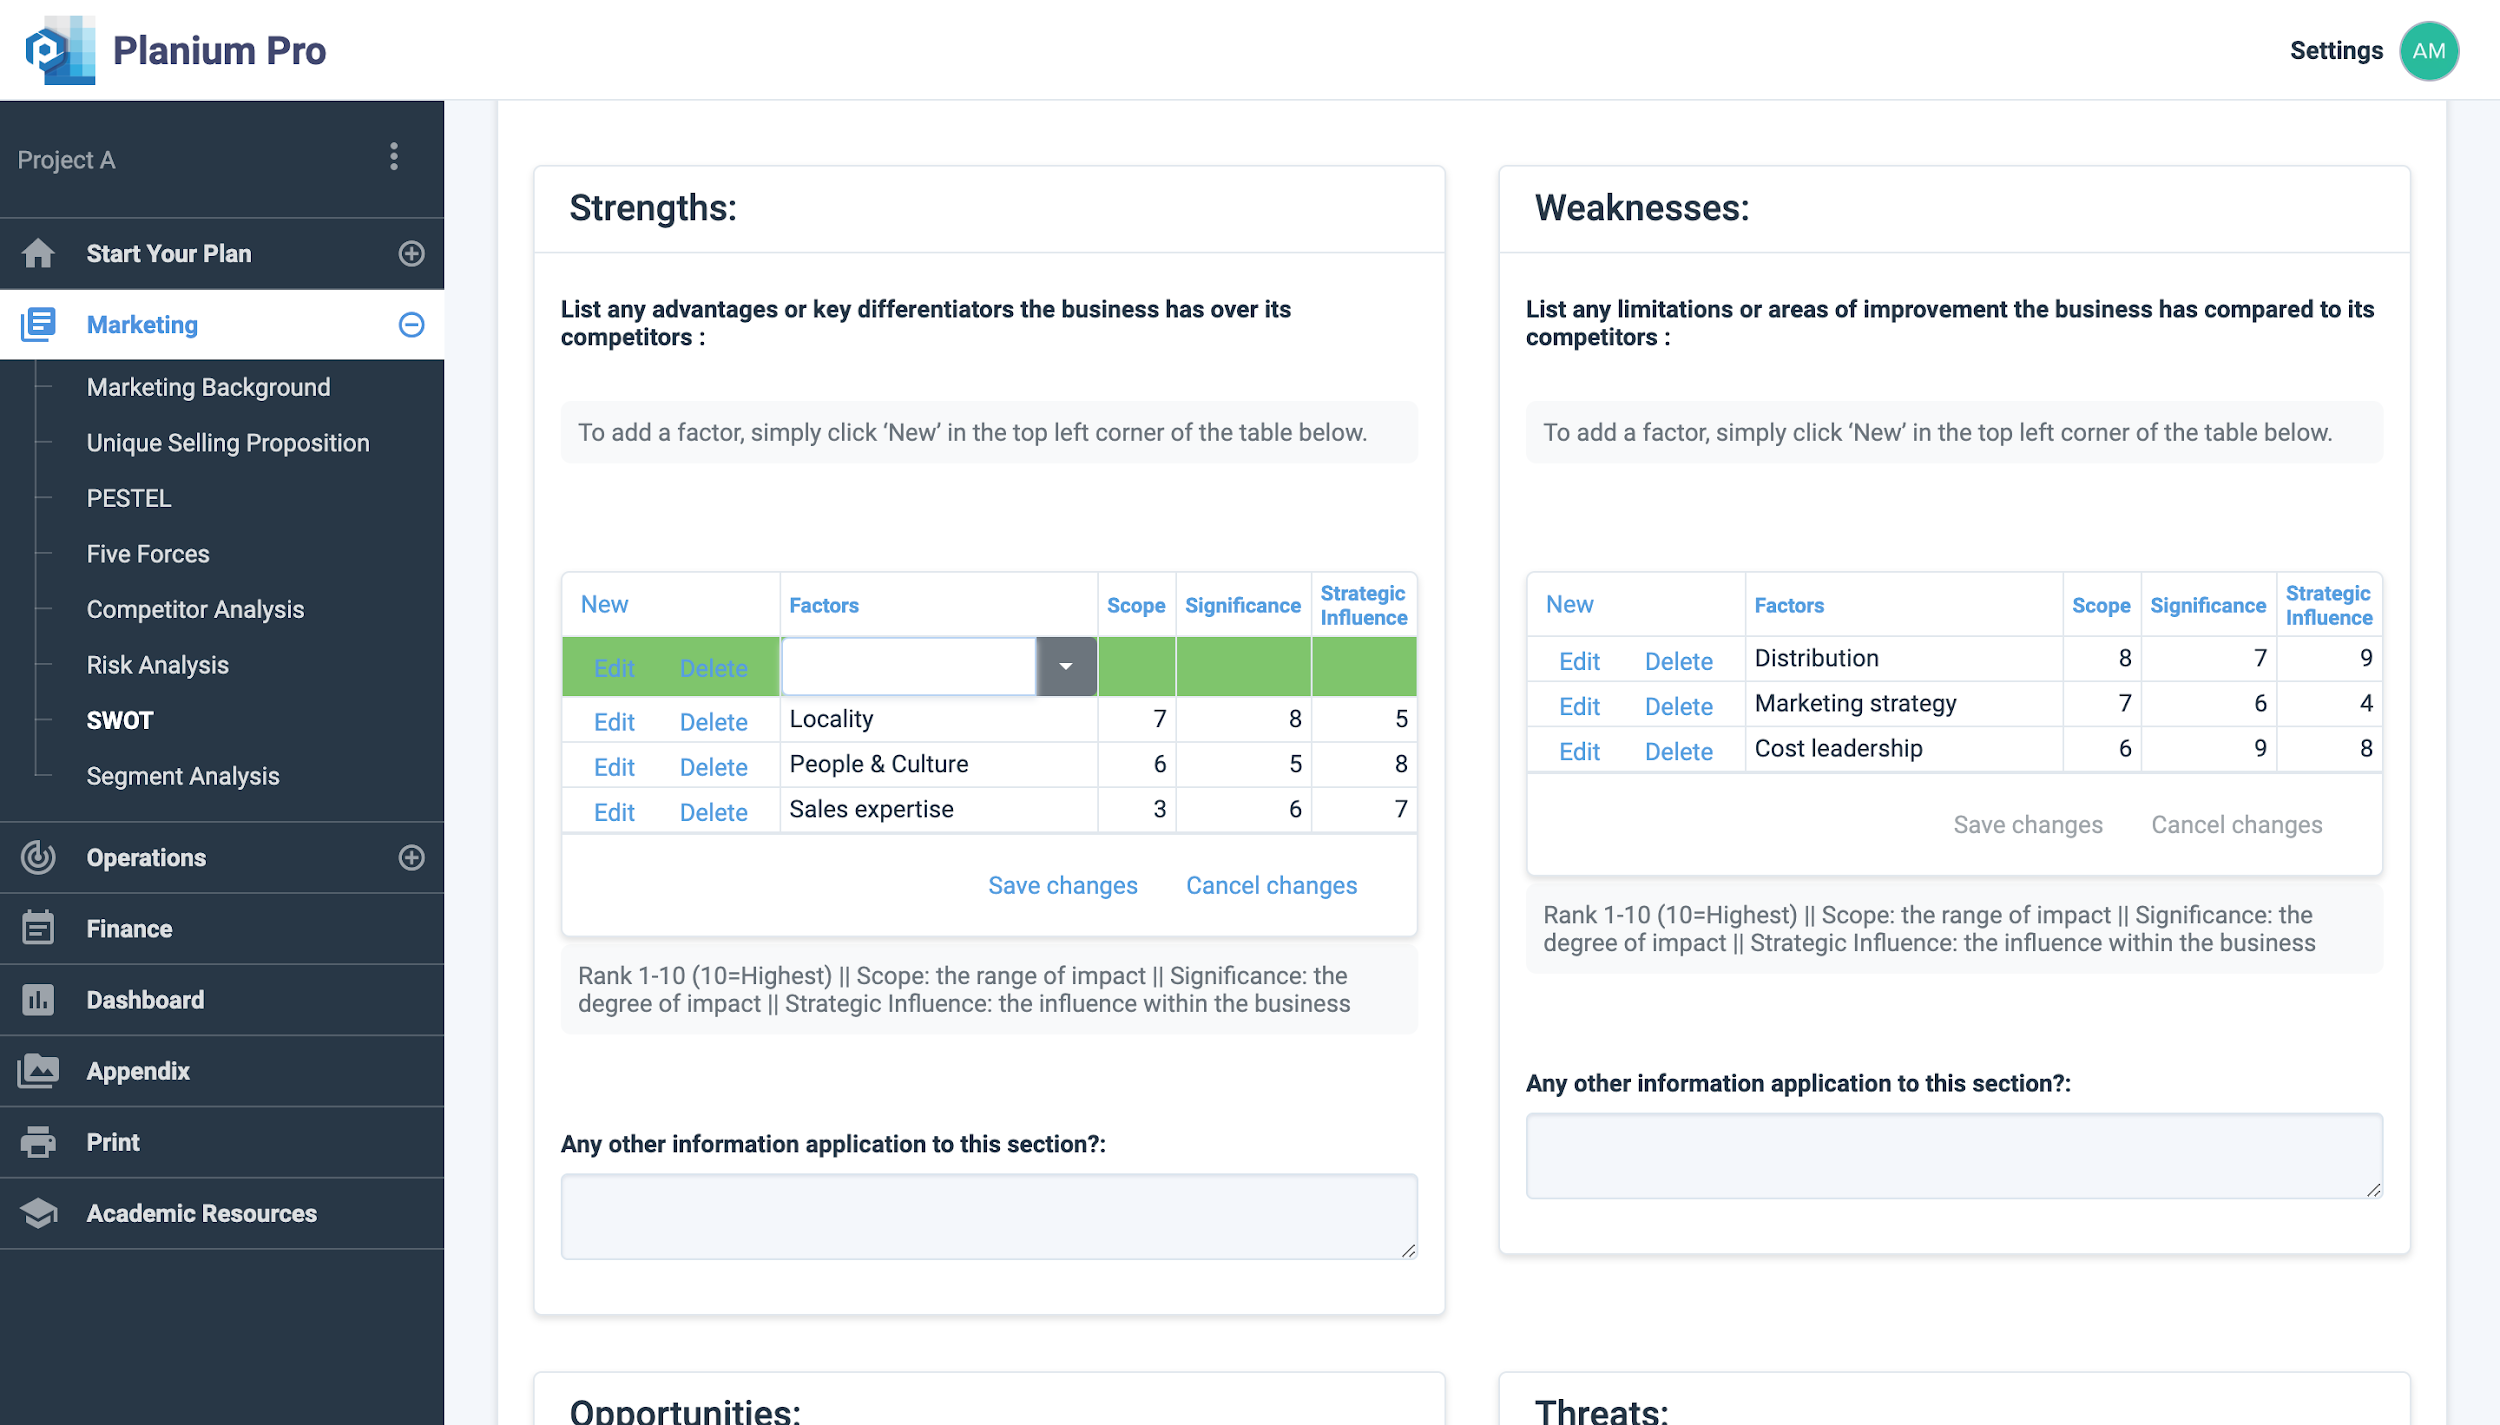
Strengths
List any advantages or key differentiators the business has over its competitors. Questions to consider asking about the business are:
- Does the business have any existing proven product and/or design concepts with fulfilled sales orders?
- Does the business have any unique patented positions in a niche area with premium capacity?
- Does the business have any worldwide brands or reputation in the field of play?
- Does the business have a diverse customer type or broad geographical reach?
Weaknesses
List any limitations or areas of improvement the business has compared to its competitors. Questions to consider asking about the business are:
- Are there any constraints against local or global objectives and market potential?
- Are there any areas that competitors have an advantage or edge?
- Is there any necessary expertise, licenses or inputs that is currently lacking?
- Are there any financial constraints that may weaken the prospects of the business?
Opportunities:
List any opportunities that exist for the business, such as emerging needs or underserved markets. Questions to consider asking about the business are:
- Are there any pent-up customer demands in current markets that could be met?
- Are there any economical, social or political trends that the business could potentially benefit from?
- Are there any competitor or supplier weaknesses that the business could potentially benefit from?
Threats:
List any threats that exist for the business, such as new competitors, negative media, or customer attitudes. Questions to consider asking about the business are:
- Are there any negative political and social trends impacting on the business?
- Are there any negative economic trends impacting on the business?
- Are there any negative technological trends impacting on the business?
- Are there any customer or supplier weaknesses that may damage the business?
Click ‘Save’ to save changes.
Click ‘Chart Preview’ to view the analysis results.
Analysing Five Forces Results on Planium Pro
Under ‘SWOT Introduction’, you can input any introductory information that may benefit your client or investor.
‘Analysis Results’ is the section to write-up the analysis on the graph and describe any key themes that are present in the data.
Click ‘Save’ to save changes.
Click ‘Report Preview’ to view the write-up in report format.
2.6.Segment Analysis
Segment Analysis
Market segmentation can be defined as the process of dividing a market into groups or subgroups based on distinct needs, characteristics, or behaviour which might require separate products or marketing mixes. The aim is to match groups of potential customers who have the same set of needs and buyer behaviour. Segmentation encourages businesses to use resources effectively, creates value for the target market, creates focus and effective positioning. However, one of the limitations of marketing segmentation is that targeting multiple segments increases marketing costs.
Requirements for effective segmentation:
- Measurable and identifiable: it must be possible to determine the key variables.
- Accessible: the segments can be reached and served.
- Substantial: the segments should be sufficiently large to be served and profitable.
- Actionable: programs can be developed effectively.
- Unique needs: the segment must respond differently to the market.
Business-to-consumers (B2C) refers to any company primarily focused on selling products and services to consumers. To better understand the behaviours of consumers, market segmentation can be based on:
- Geographical segmentation: city, state, country, climate or density.
- Demographic segmentation: Age, gender, occupation, education, and family life cycle.
- Psychographic segmentation: personality traits, lifestyle or values.
- Behavioural segmentation: usage rate, benefits, attitude towards product or service.
Business-to-business (B2B) refers to any company primarily focused on selling products and services to other business rather than consumers. There are B2B companies in every industry, for example in automobile manufacturing—the manufacturer purchases all materials and components of the vehicle from various suppliers. B2B model requires careful planning and can be segmented by:
- Demographic segmentation: Industry, location or business size.
- Operating variables: customer capabilities, usage status, and technology.
- Purchasing approaches: nature of the relationship, purchasing criteria and policies.
- Situational factors: specific application, order size, urgency.
- Personal characteristics: benefits, attitude towards the product or service.
Using Segment Analysis on Planium Pro
To complete this section, on the left-hand side menu bar, click the + to expand the ‘Marketing’ menu and select ‘Segment Analysis’
Step 1: Segmentation
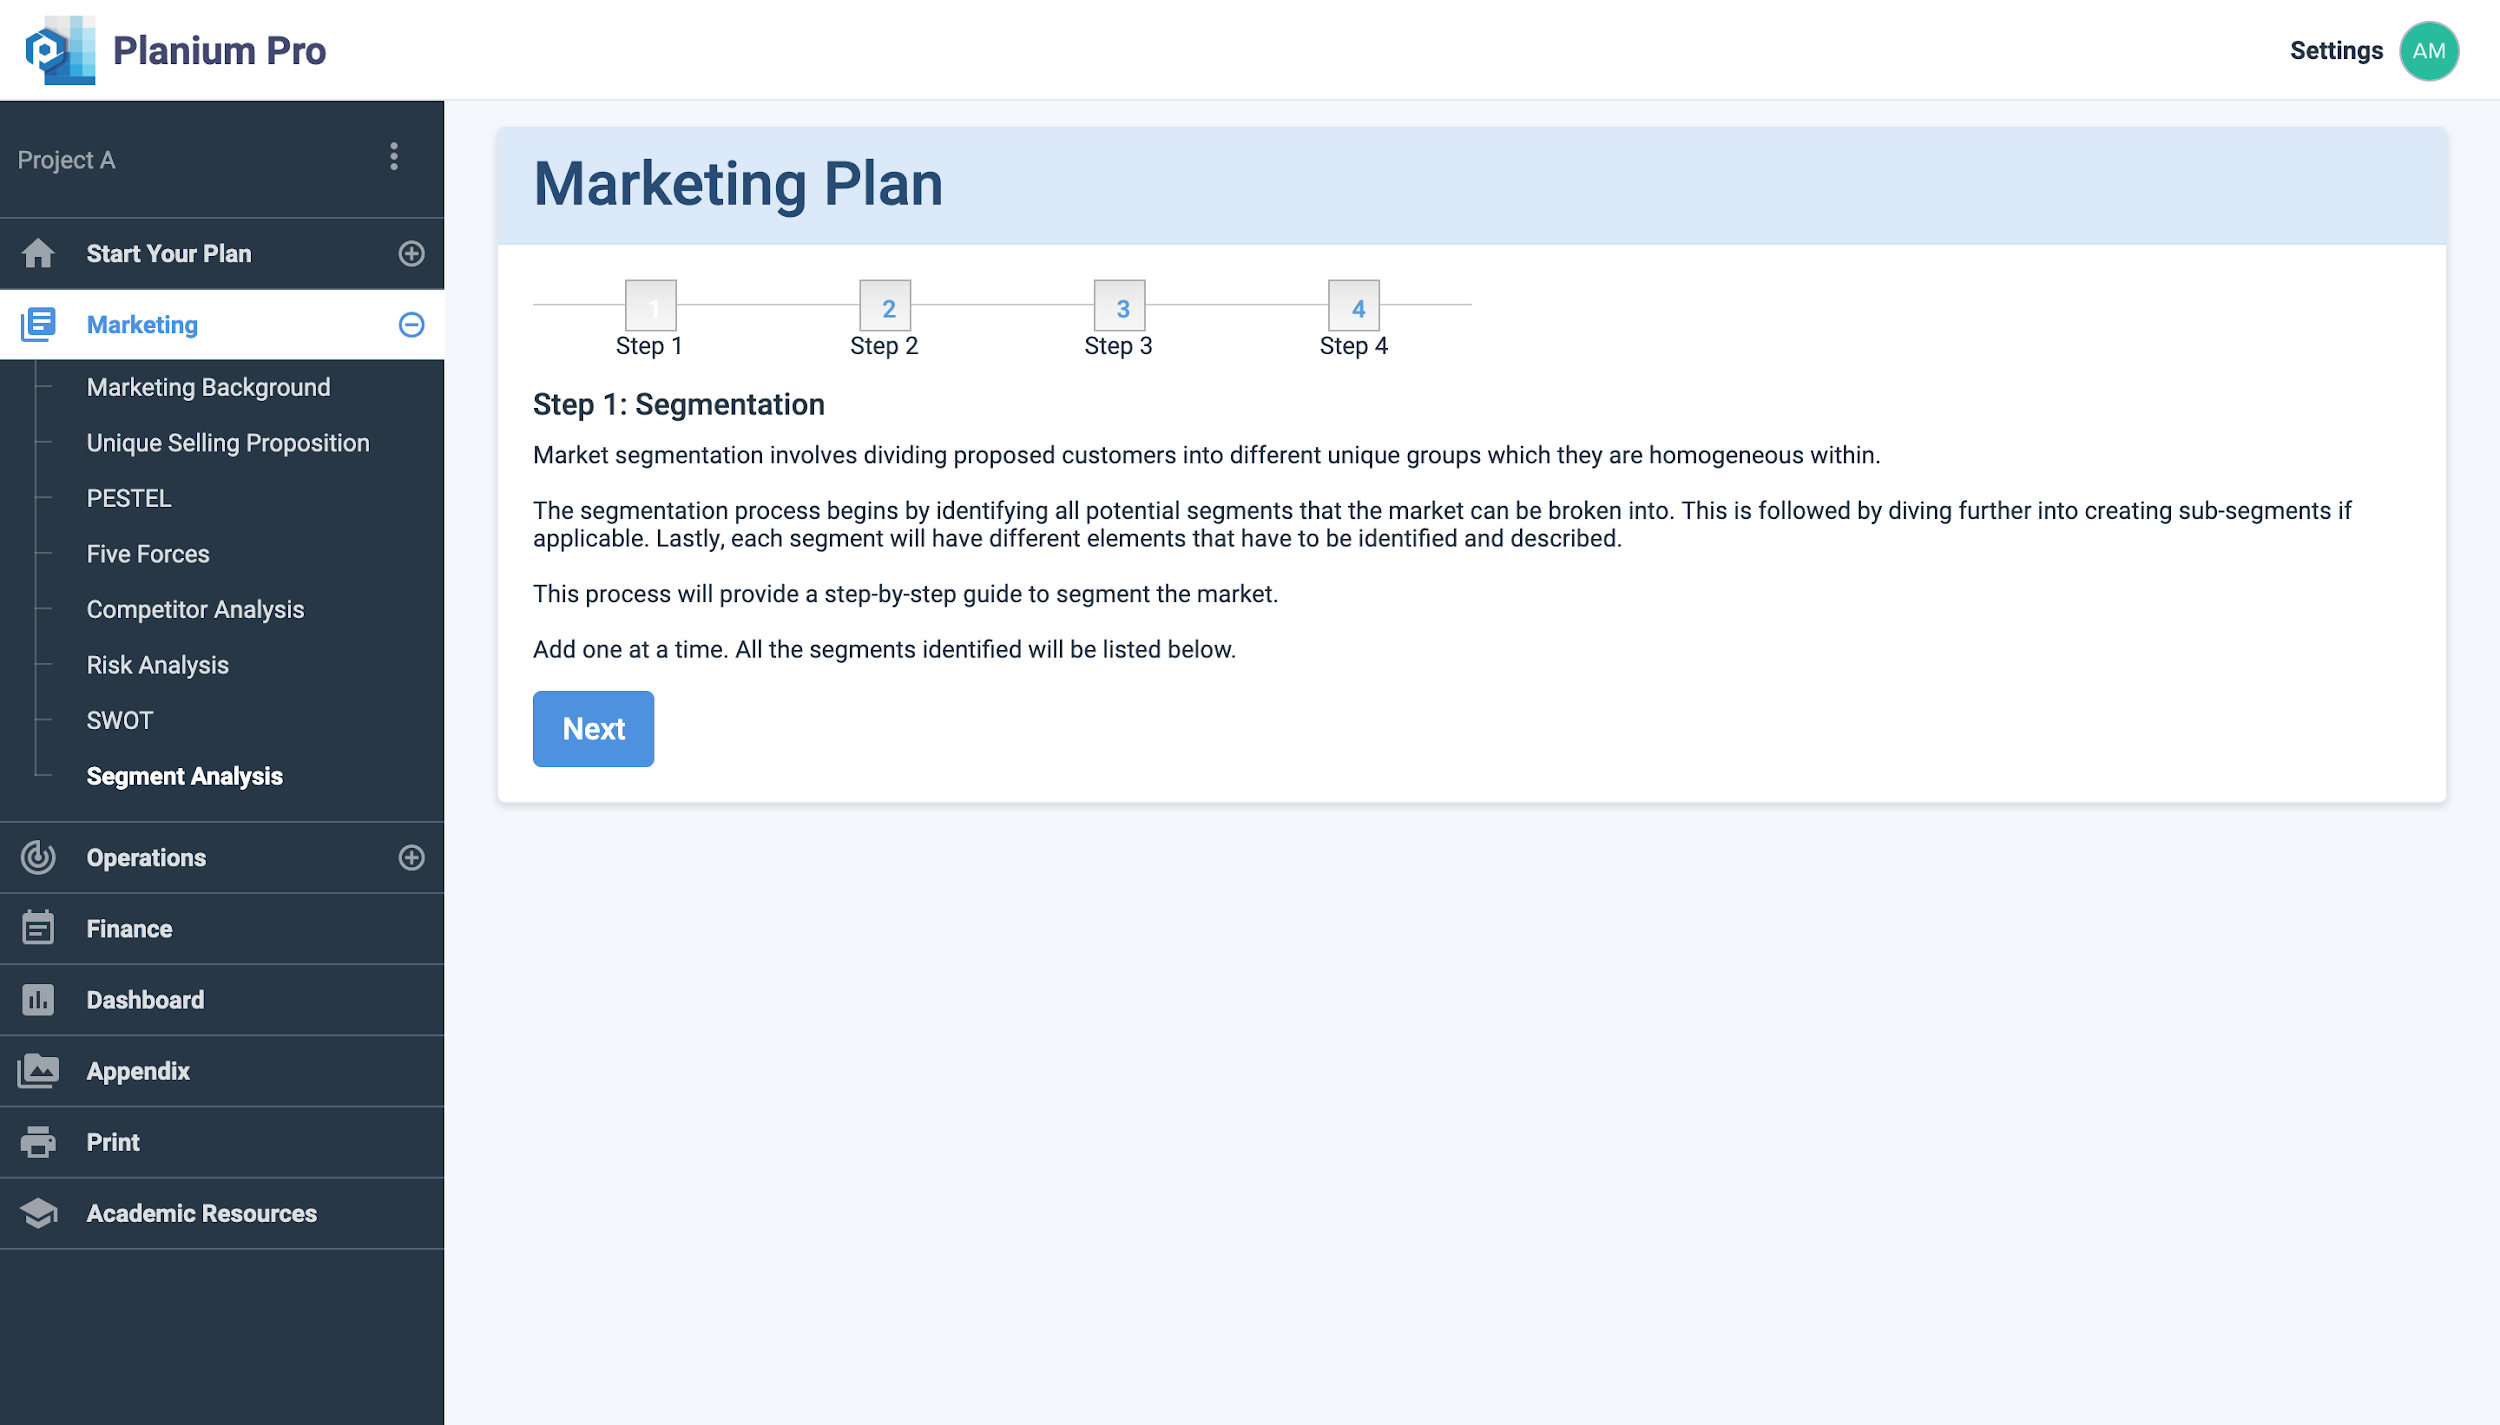
The segmentation process begins by identifying all potential segments that the market can be broken into. This is followed by diving further into creating sub-segments if applicable. Lastly, each segment will have different elements that have to be identified and described.
This process will provide a step-by-step guide to segment the market. Add one segment at a time. All the segments identified will be listed below.
Click ‘Next’ to start the segmentation process.
Step 2: Add a new Segment
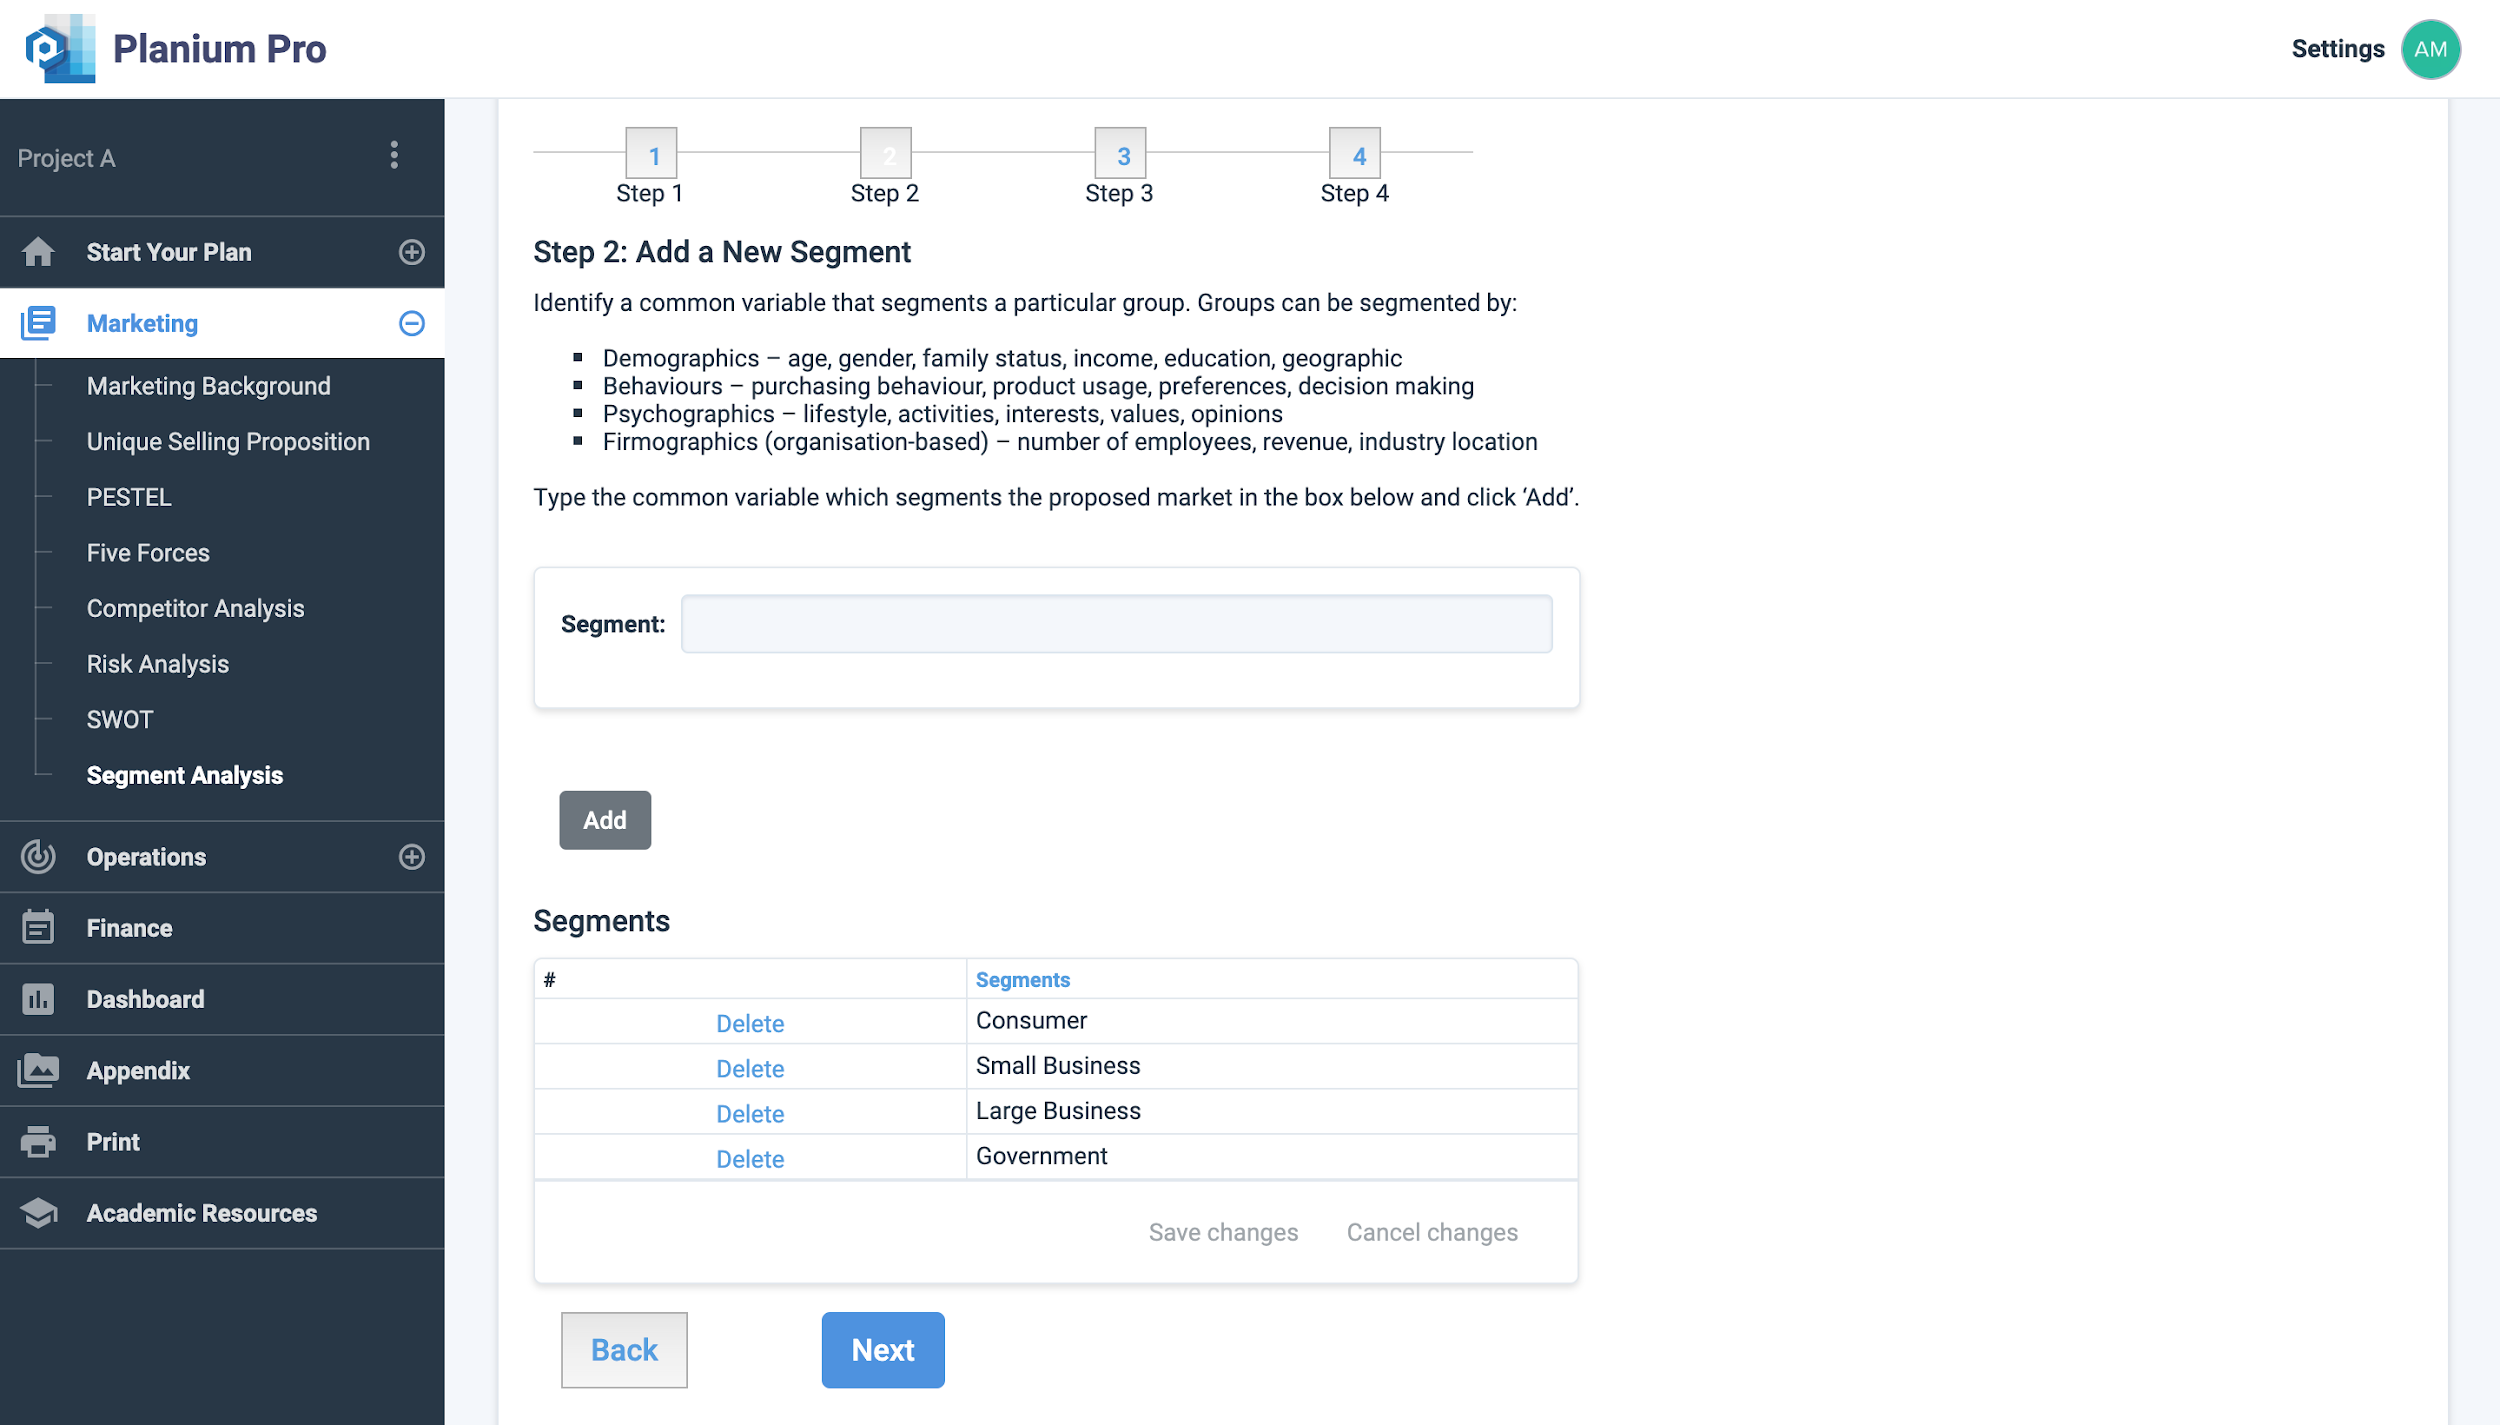
Choose a common variable for your market segmentation:
- Demographics – age, gender, family status, income, occupation.
- Behaviour – Purchasing behaviour, product usage, preferences, decision making.
- Psychographics – lifestyle, activities, interests, opinions.
- Firmographics (organisation-based)- number of employees, revenue, industry location.
Type the common variable which segments the proposed market in the box below and click ‘Add’. Add as many segments the business may have.
Click ‘Next’ to move to the next step in the segmentation process.
Step 3: Segment Structure
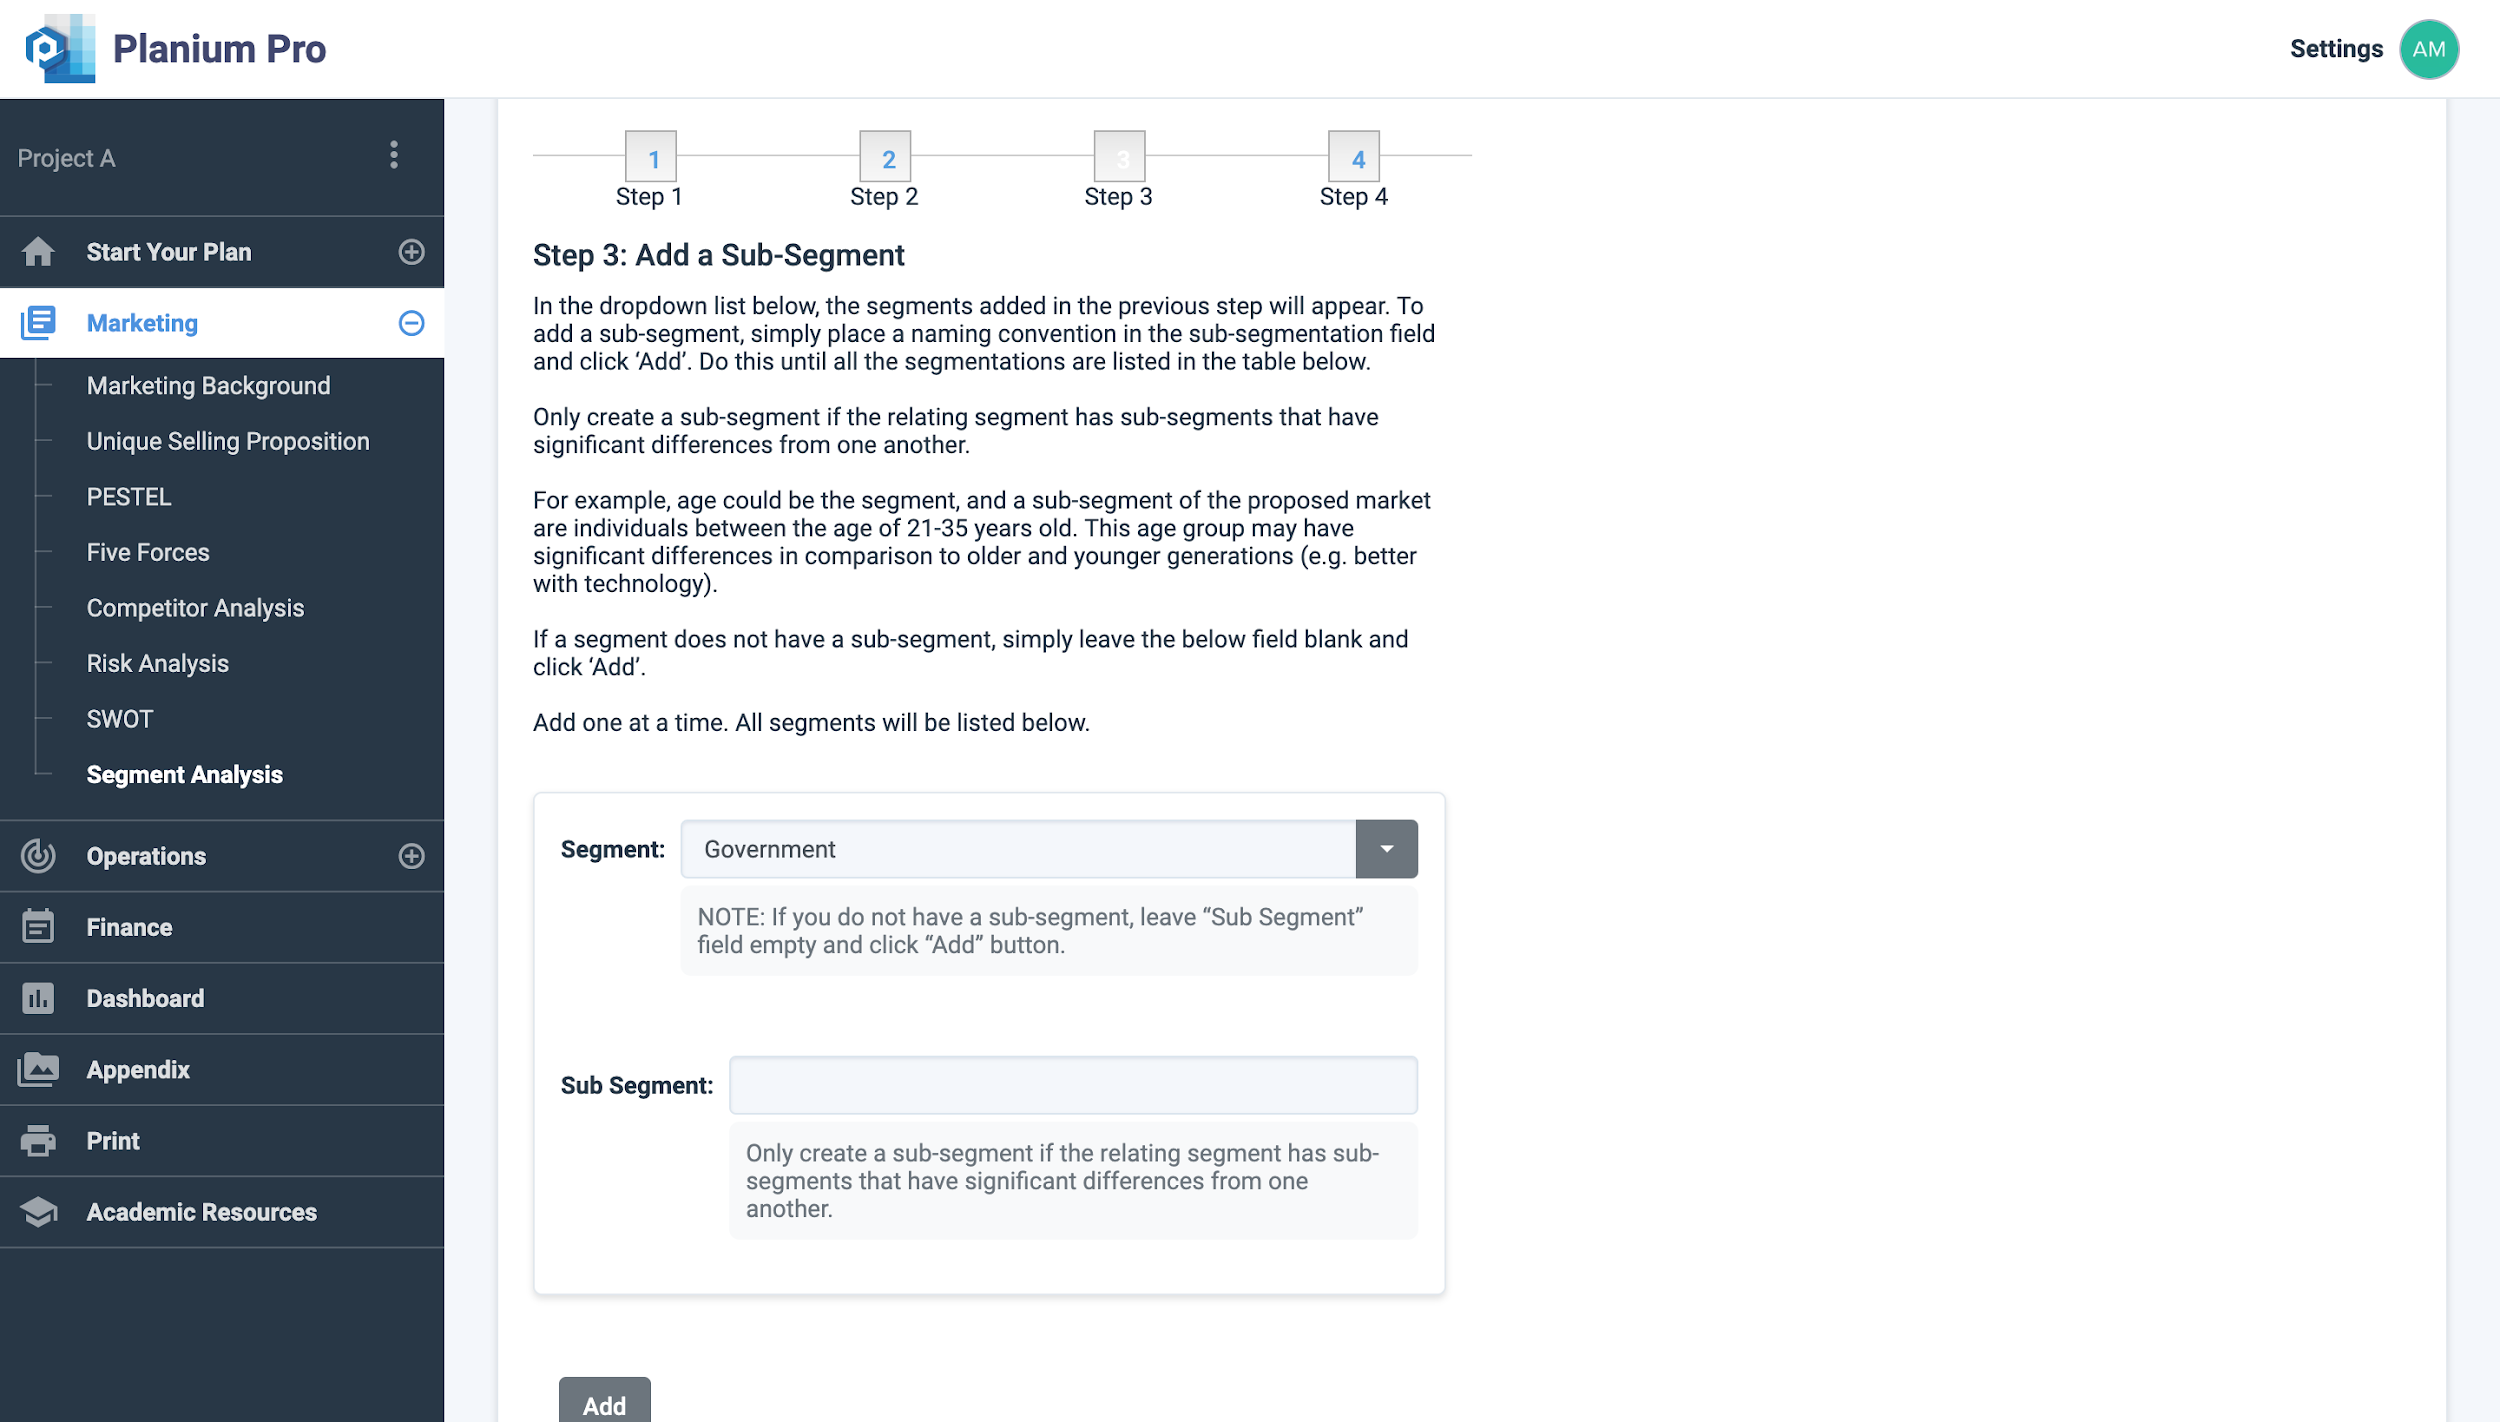
- Segment: If there is sub-segment, then leave this field empty and click ‘Add’
- Sub Segment: only create a sub-segment if the relating segment has sub-segment that have significant difference from one another.
Click ‘Next’ to move to the next step in the segmentation process.
Step 4: Segmentation Details
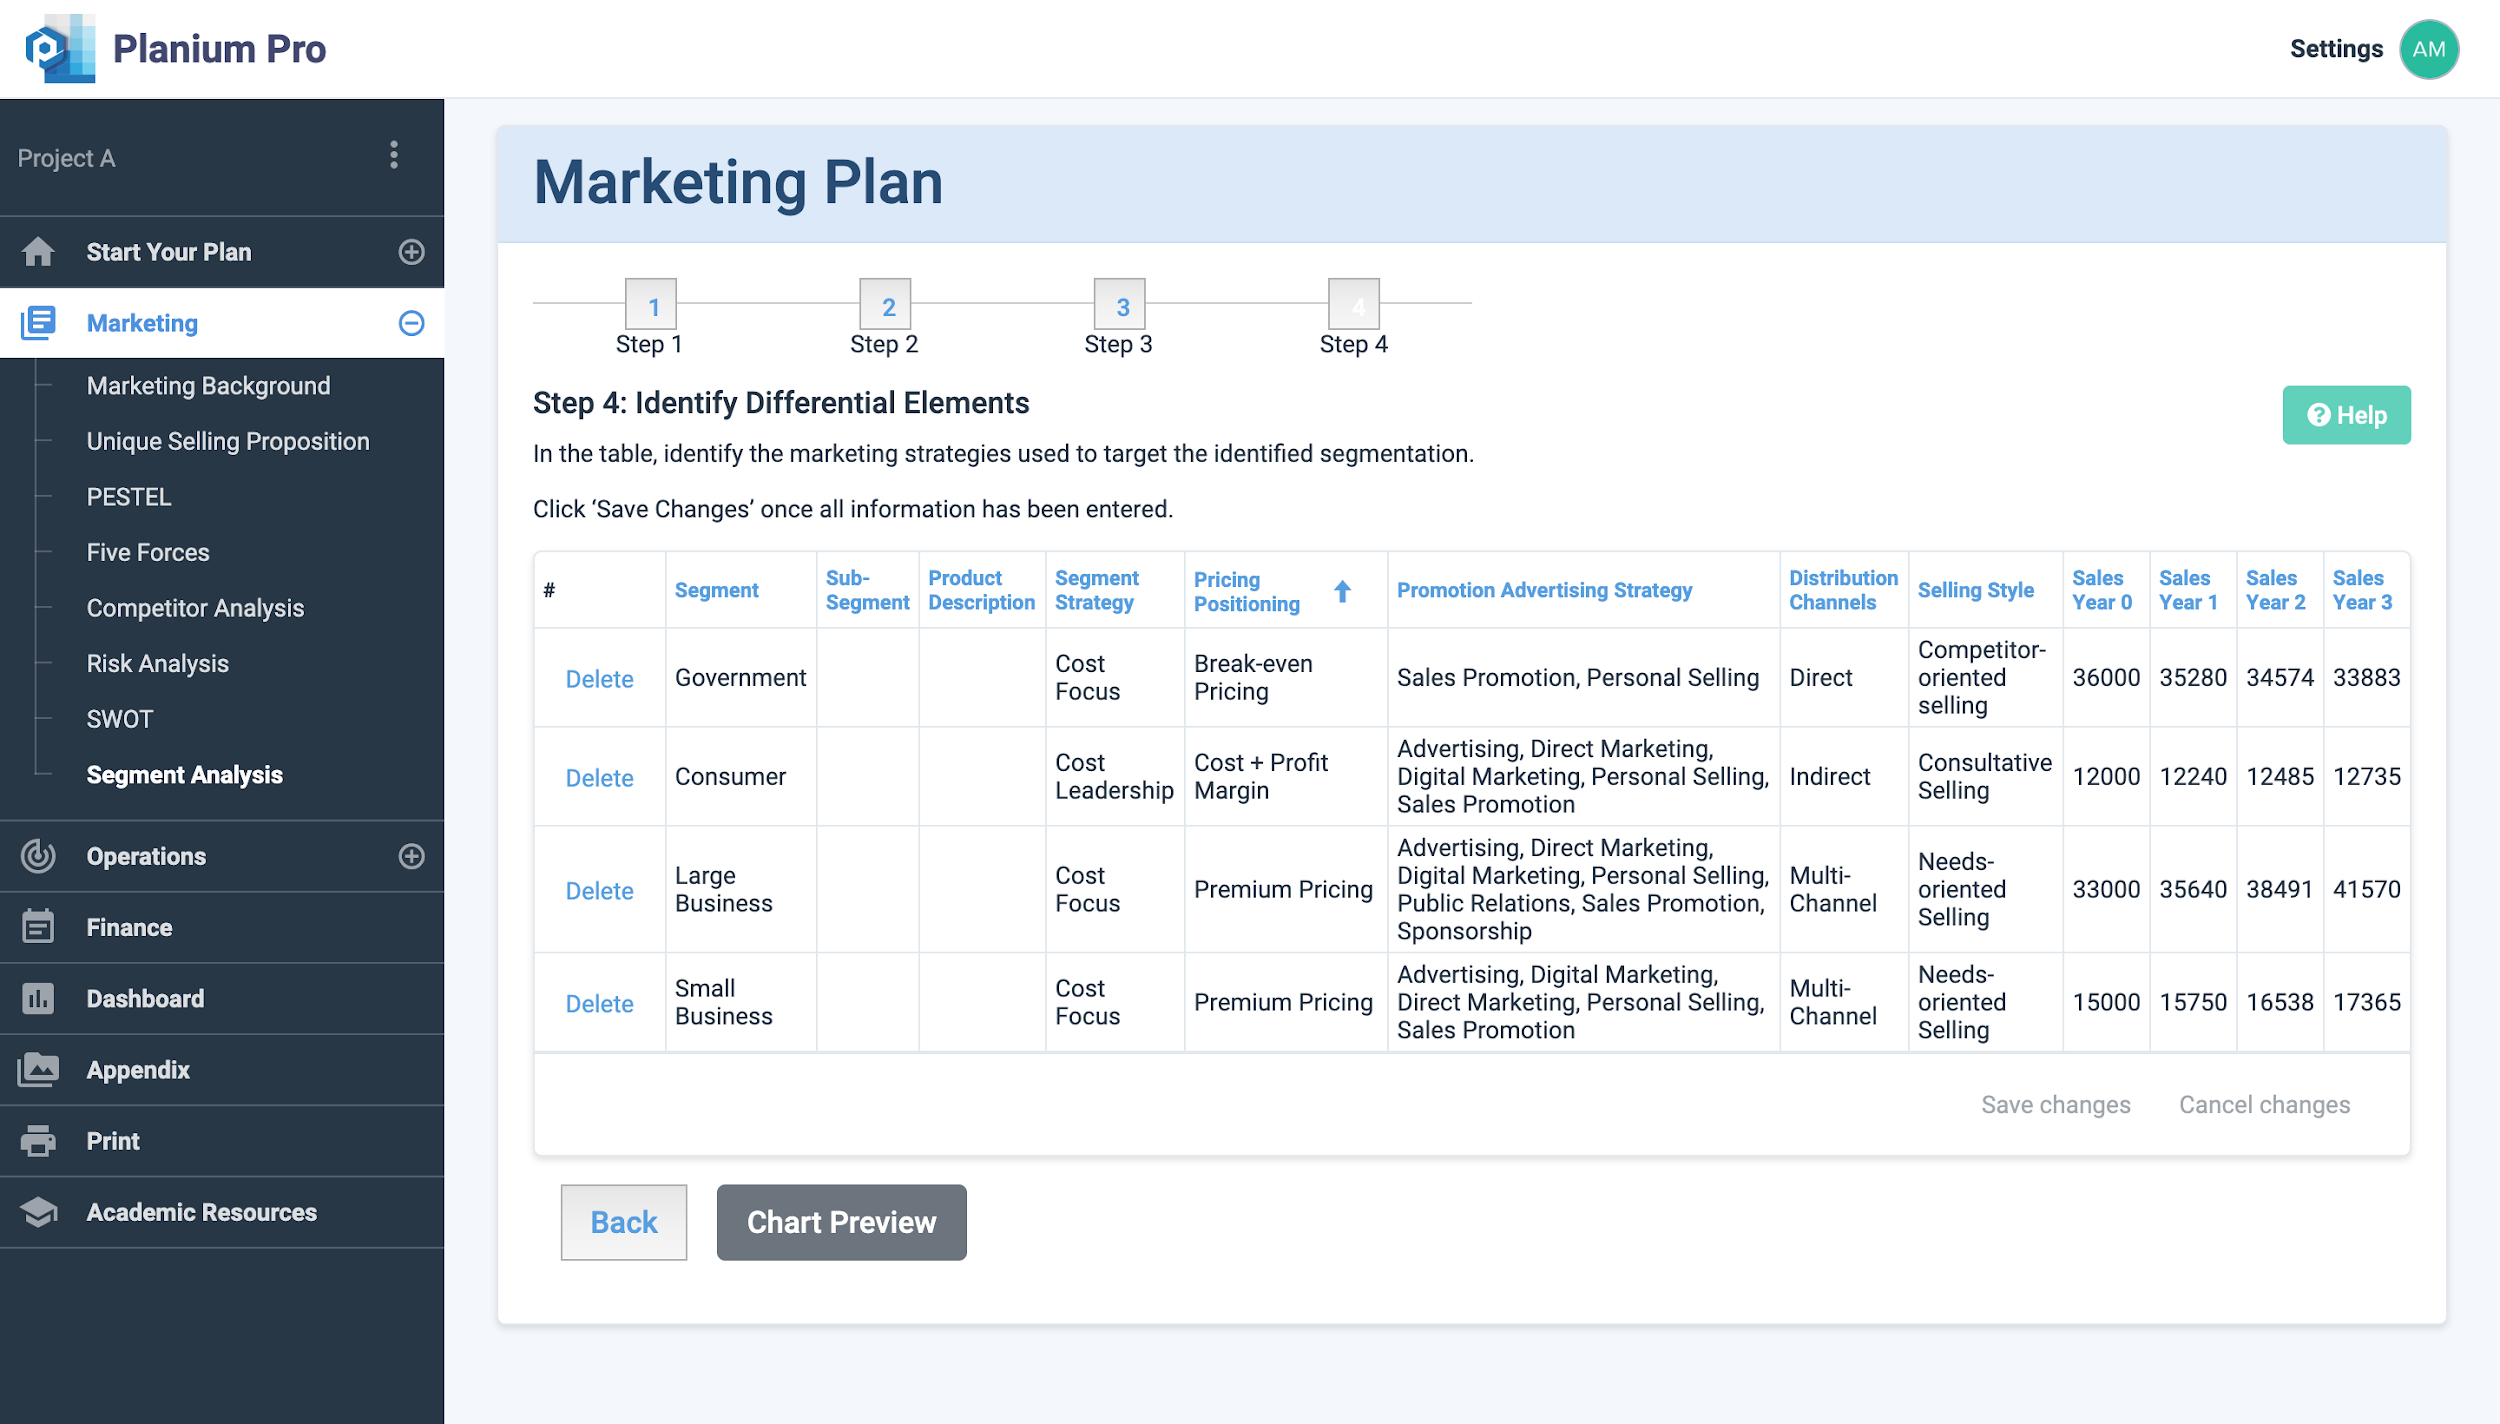
This final stage produces a summary table where you can identify the type of pricing positioning, marketing strategy and distribution channels should be used in each segment.
Descriptors for each of the fields are listed below:
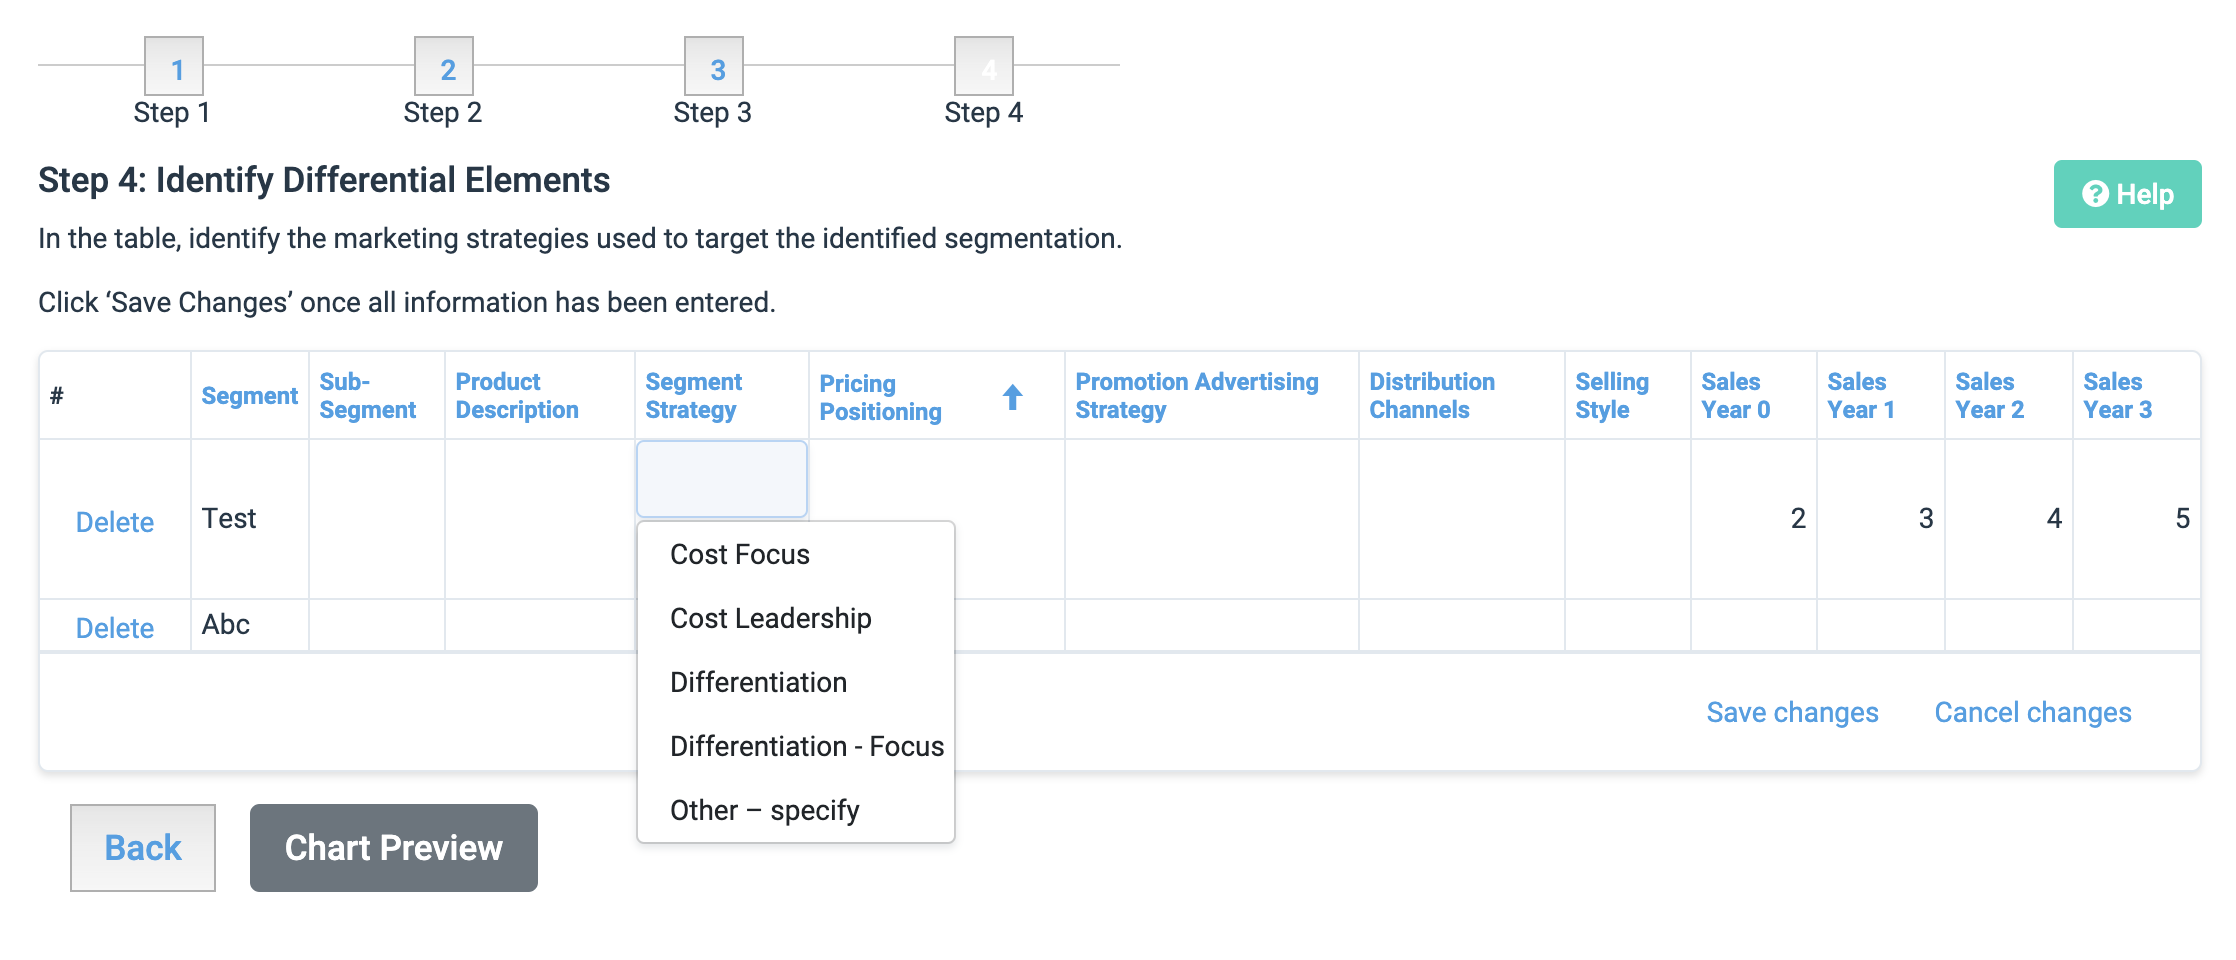
Segment Strategy:
Cost Leadership: no frills approach to minimise cost for the business
Cost Focus: emphasising cost-minimisation within a focused market
Differentiation: creating uniquely desirable products and services
Differentiation Focus: pursuing strategic differentiation within a focused market
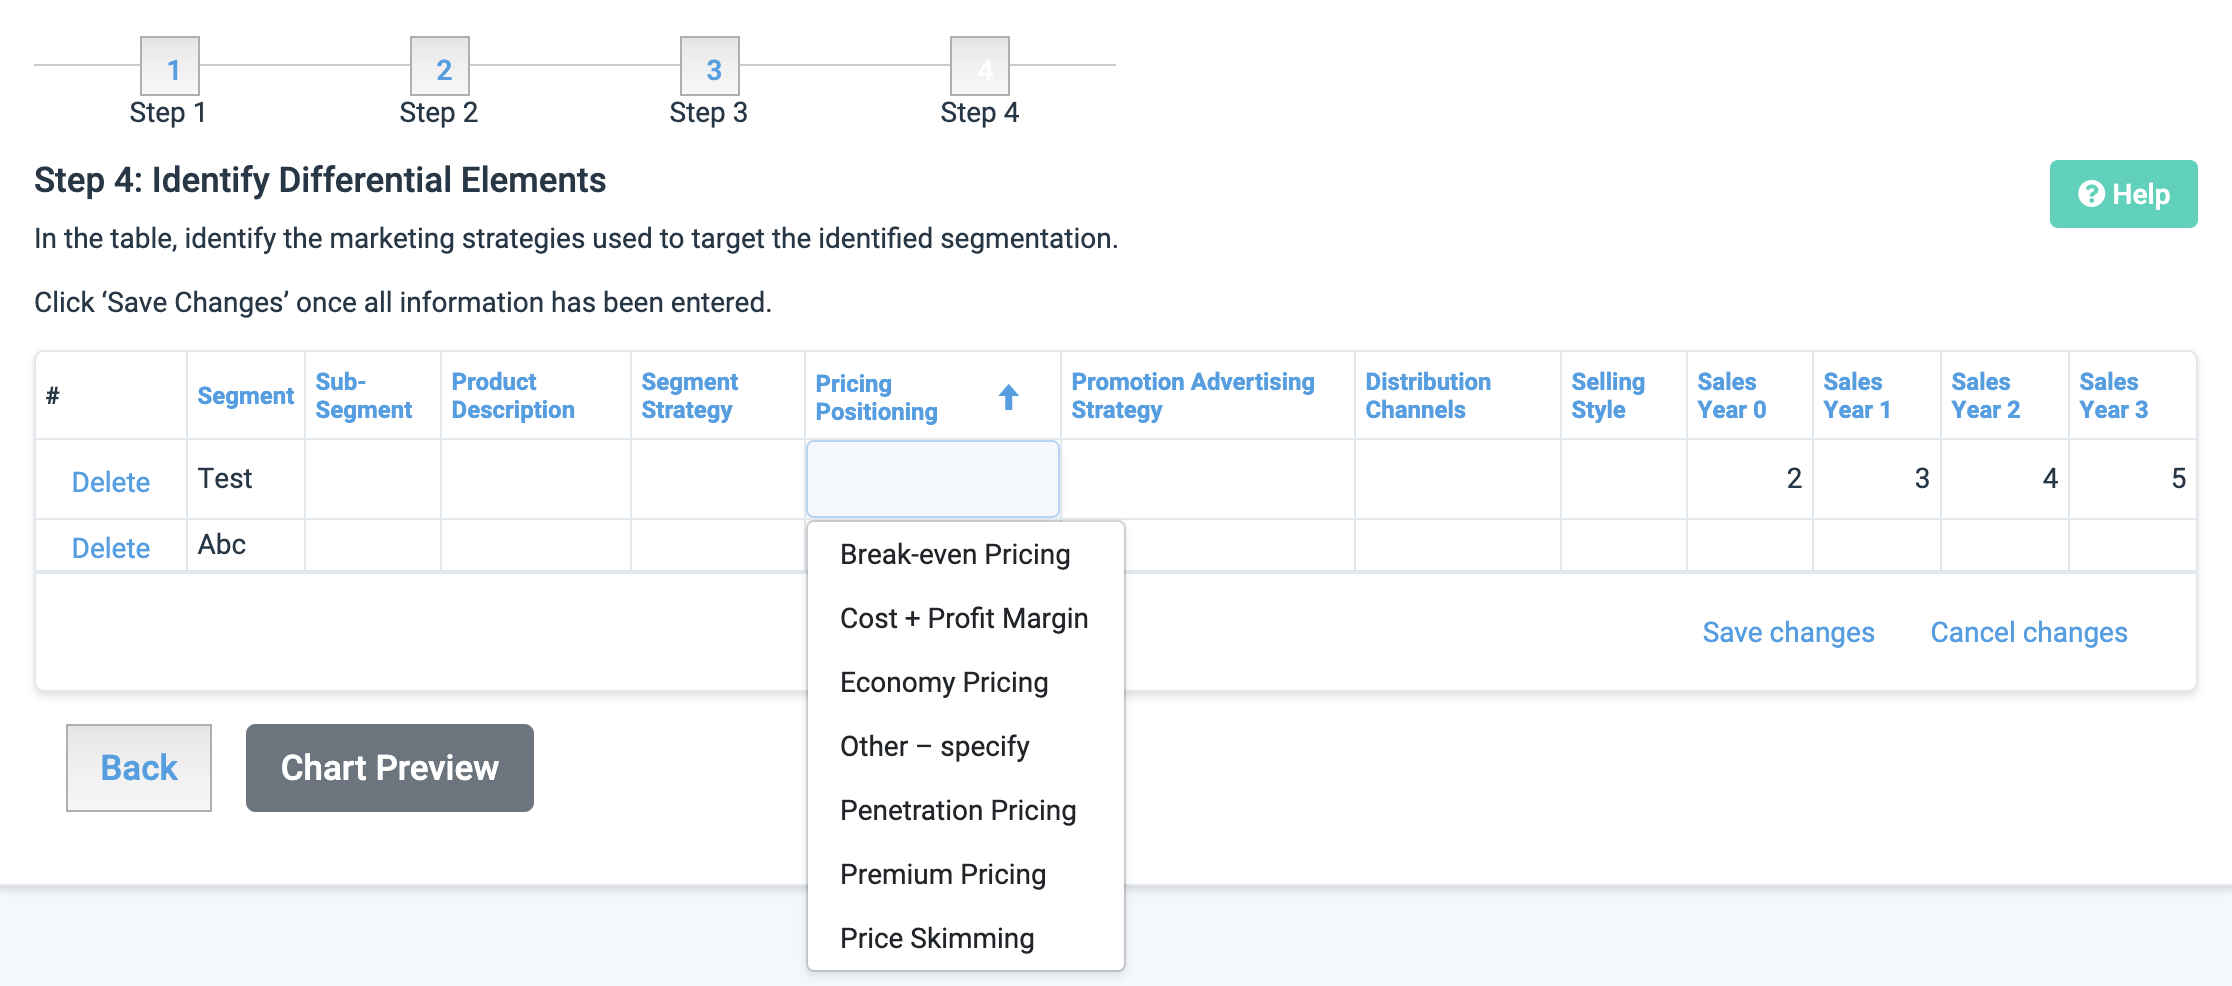
Pricing Positioning:
Break-even Pricing: revenue is equal to cost
Cost + Profit Margin: revenue is more than cost, resulting in a profit margin
Economy Pricing: low marketing and production costs, suited to large sales volumes
Penetration Pricing: low prices on goods and services to attract buyers, initial loss of income
Premium Pricing: costs higher than competitors, often used for unique goods
Price Skimming: high introductory prices, lowering slowly with new competitors
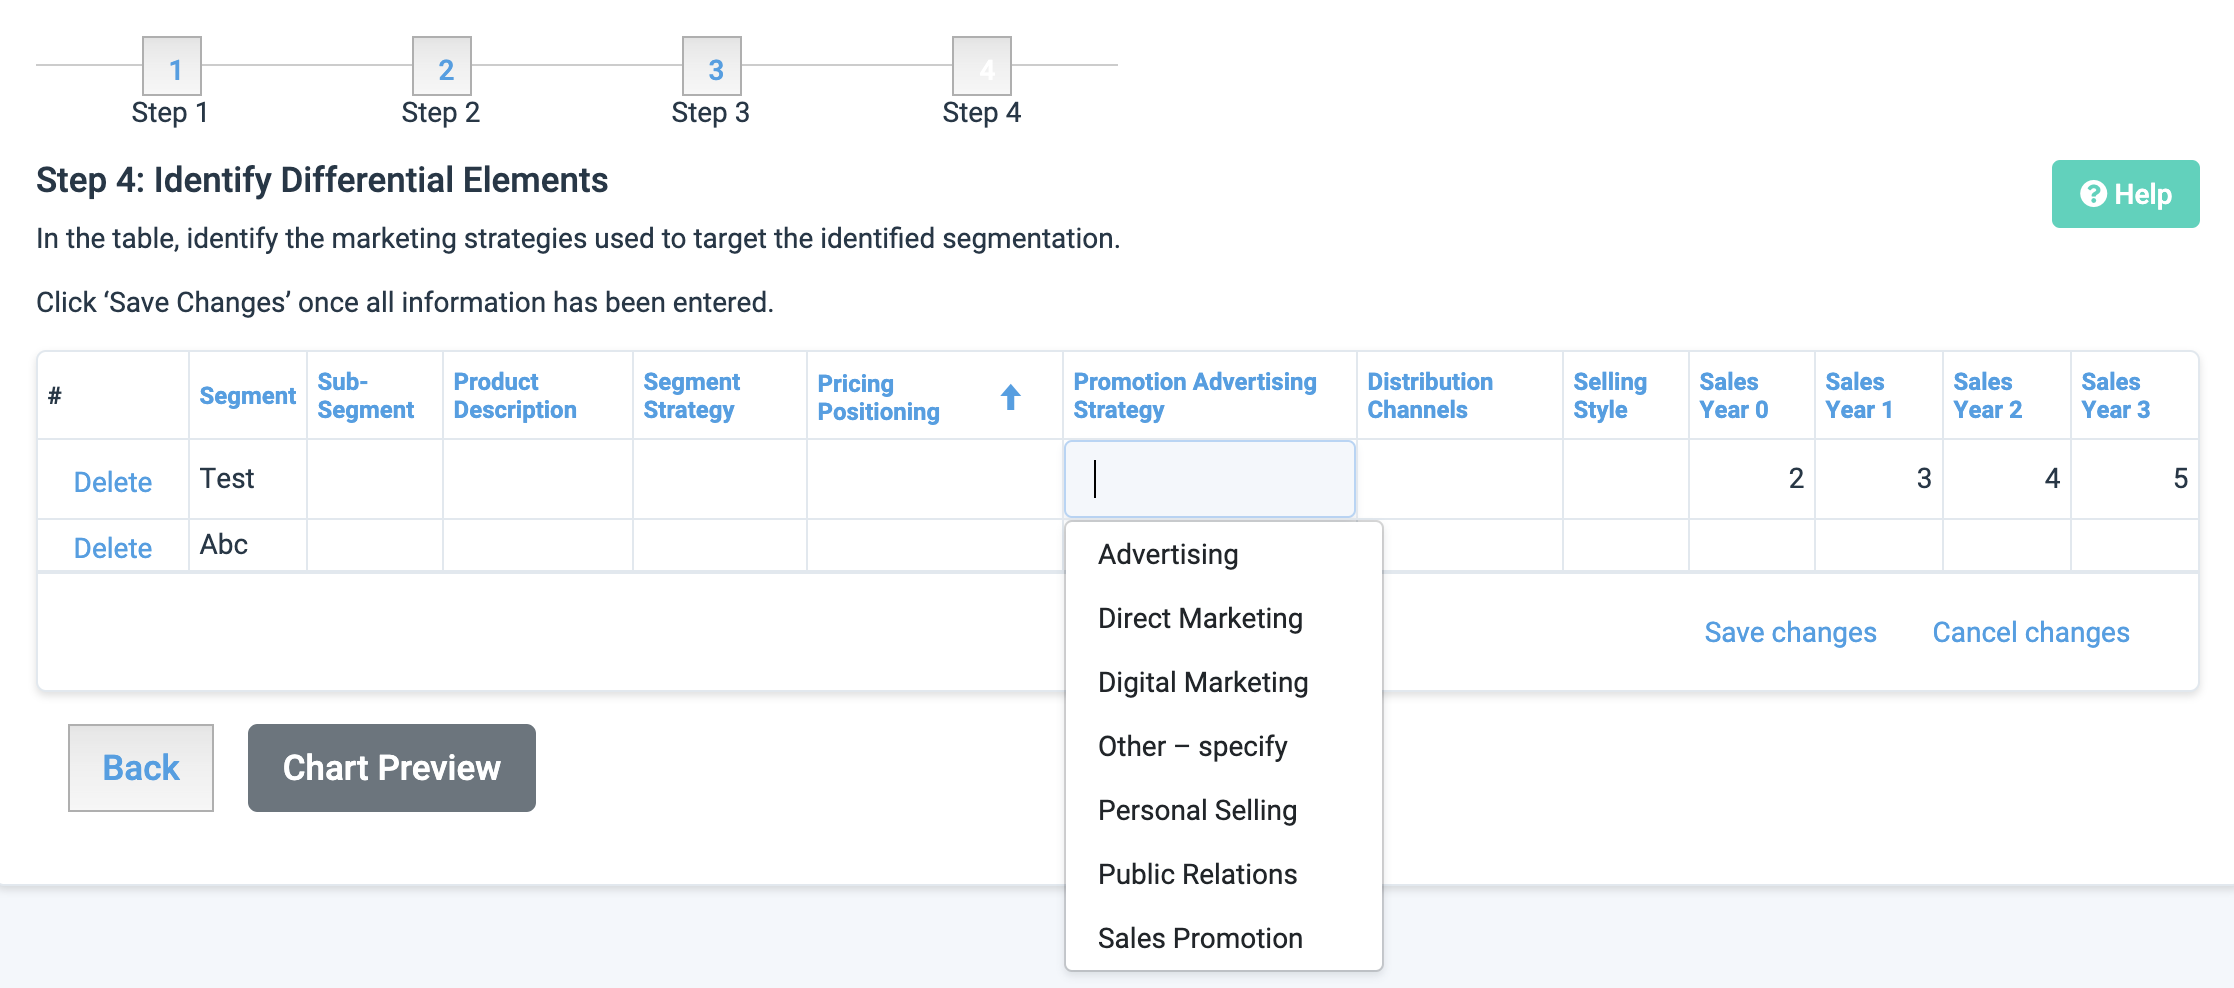
Promotion Advertising Strategy:
Advertising: advertisements (radio, tv, billboard, newspaper, magazine), infomercials
Direct Marketing: point-of-sale displays, telemarketing, email
Digital Marketing: website, social media, blogging, newsletter sign-up
Personal Selling: utilising personal networks and connections
Public Relations: media introductions, PR events, news/media releases
Sales Promotion: coupons, discounts, referral programs, loyalty incentives
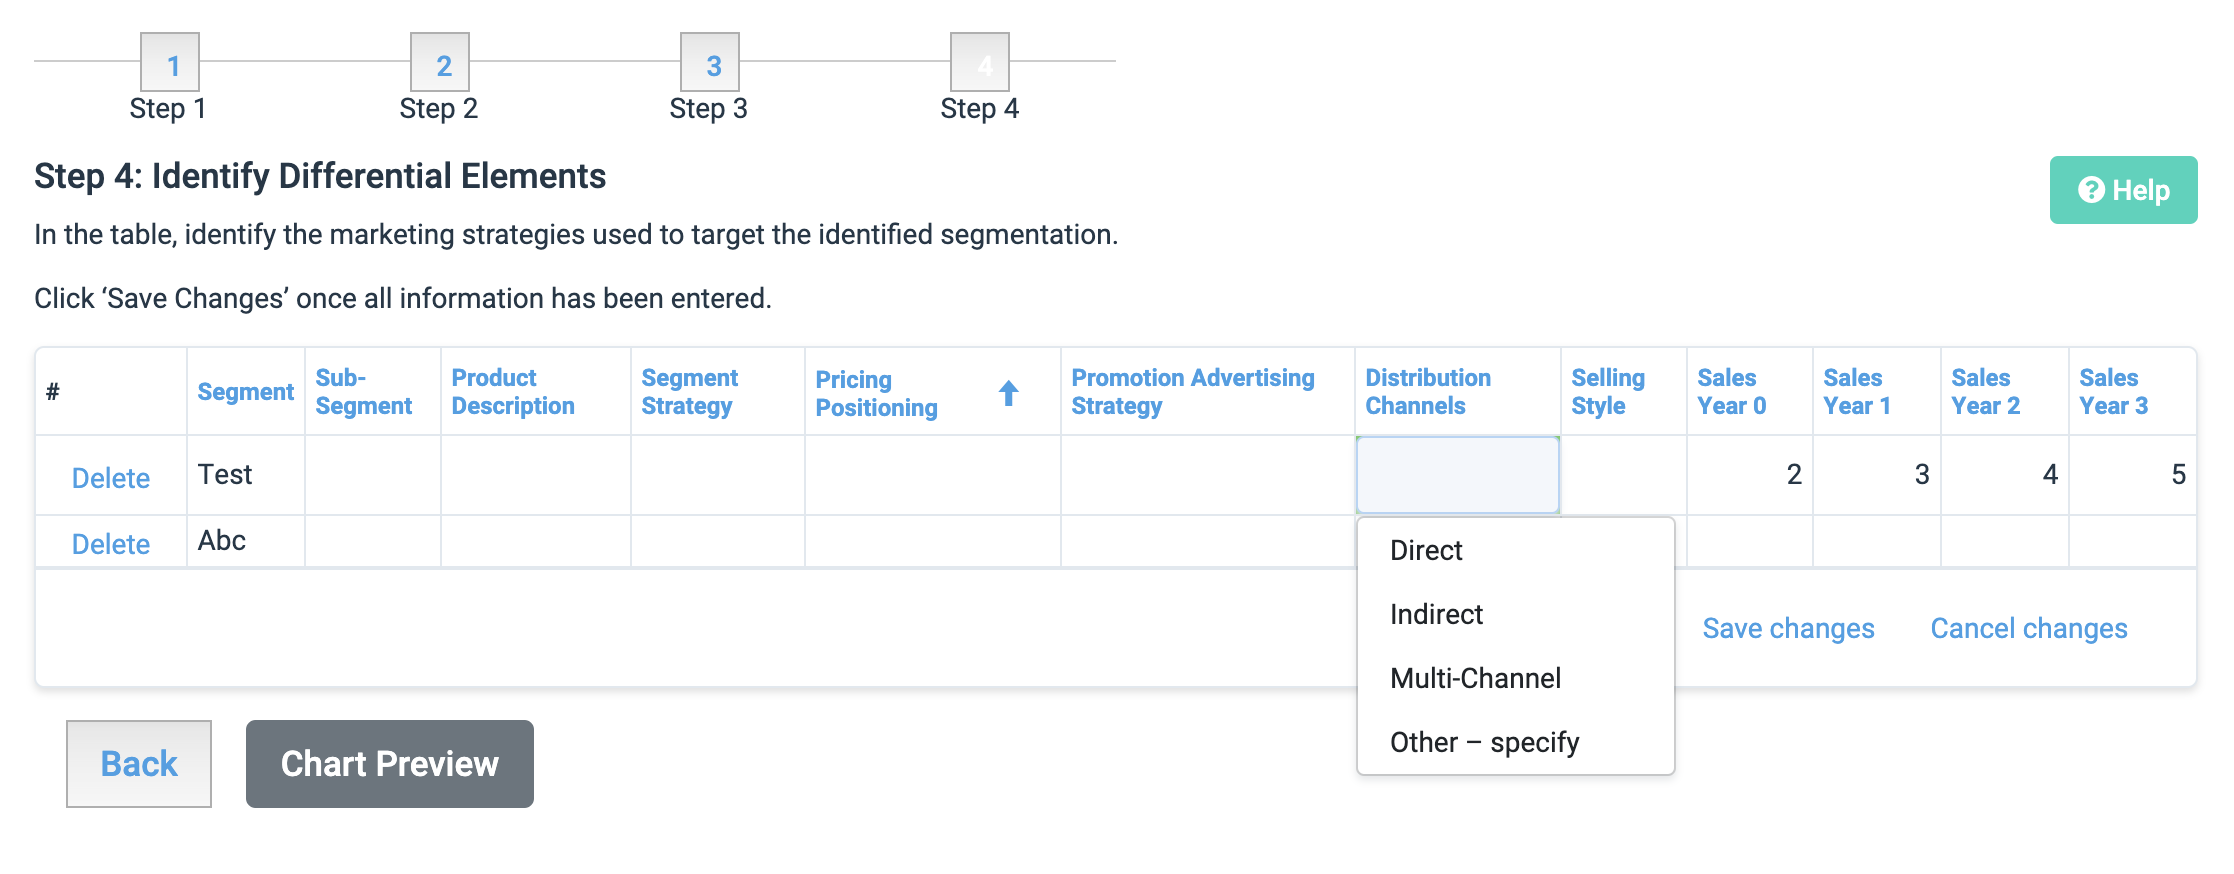
Distribution Channels:
Direct: direct to end-user without any interference
Indirect: involves third-parties such as wholesalers, retailers, licensing, franchisee
Multi-channel: utilising multiple channels simultaneously to reach end-user
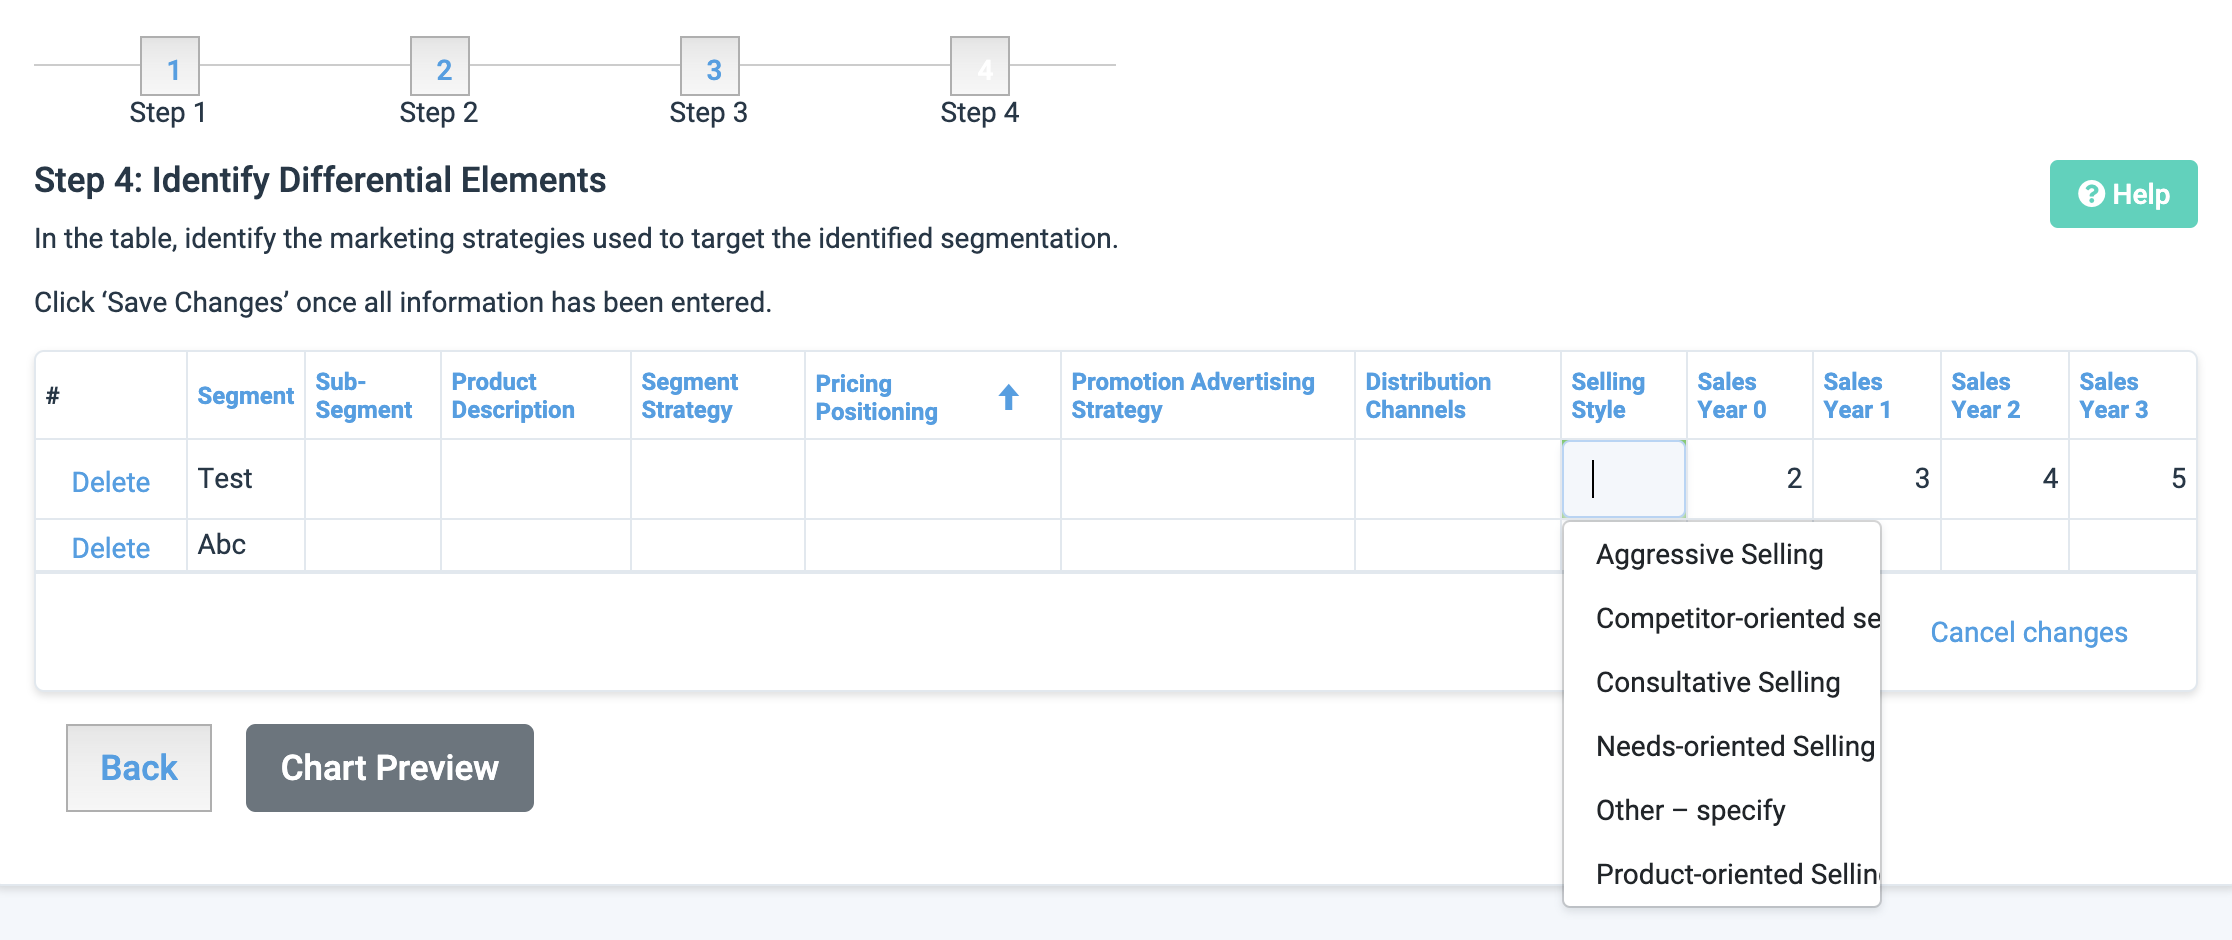
Selling Style:
Aggressive Selling: hard-driving selling style, highly focused on making sales on first attempt
Competitor-Oriented Selling: overcomes buyer objections by highlighting benefits over competitors
Consultative Selling: aims to get the best possible result for the buyer, sale occurs over time
Needs-Oriented Selling: focus is on buyer needs, ability to be highly tactful and a problem-solver
Product-Oriented Selling: explain features and benefits until buyer is convinced of benefits
Once all fields have been filled, enter the predicted sales for the first 3 years of the business.
Click ‘Save’ to save changes.
Click ‘Chart Preview’ to view the analysis results.
Analysing Segment Analysis Results on Planium Pro
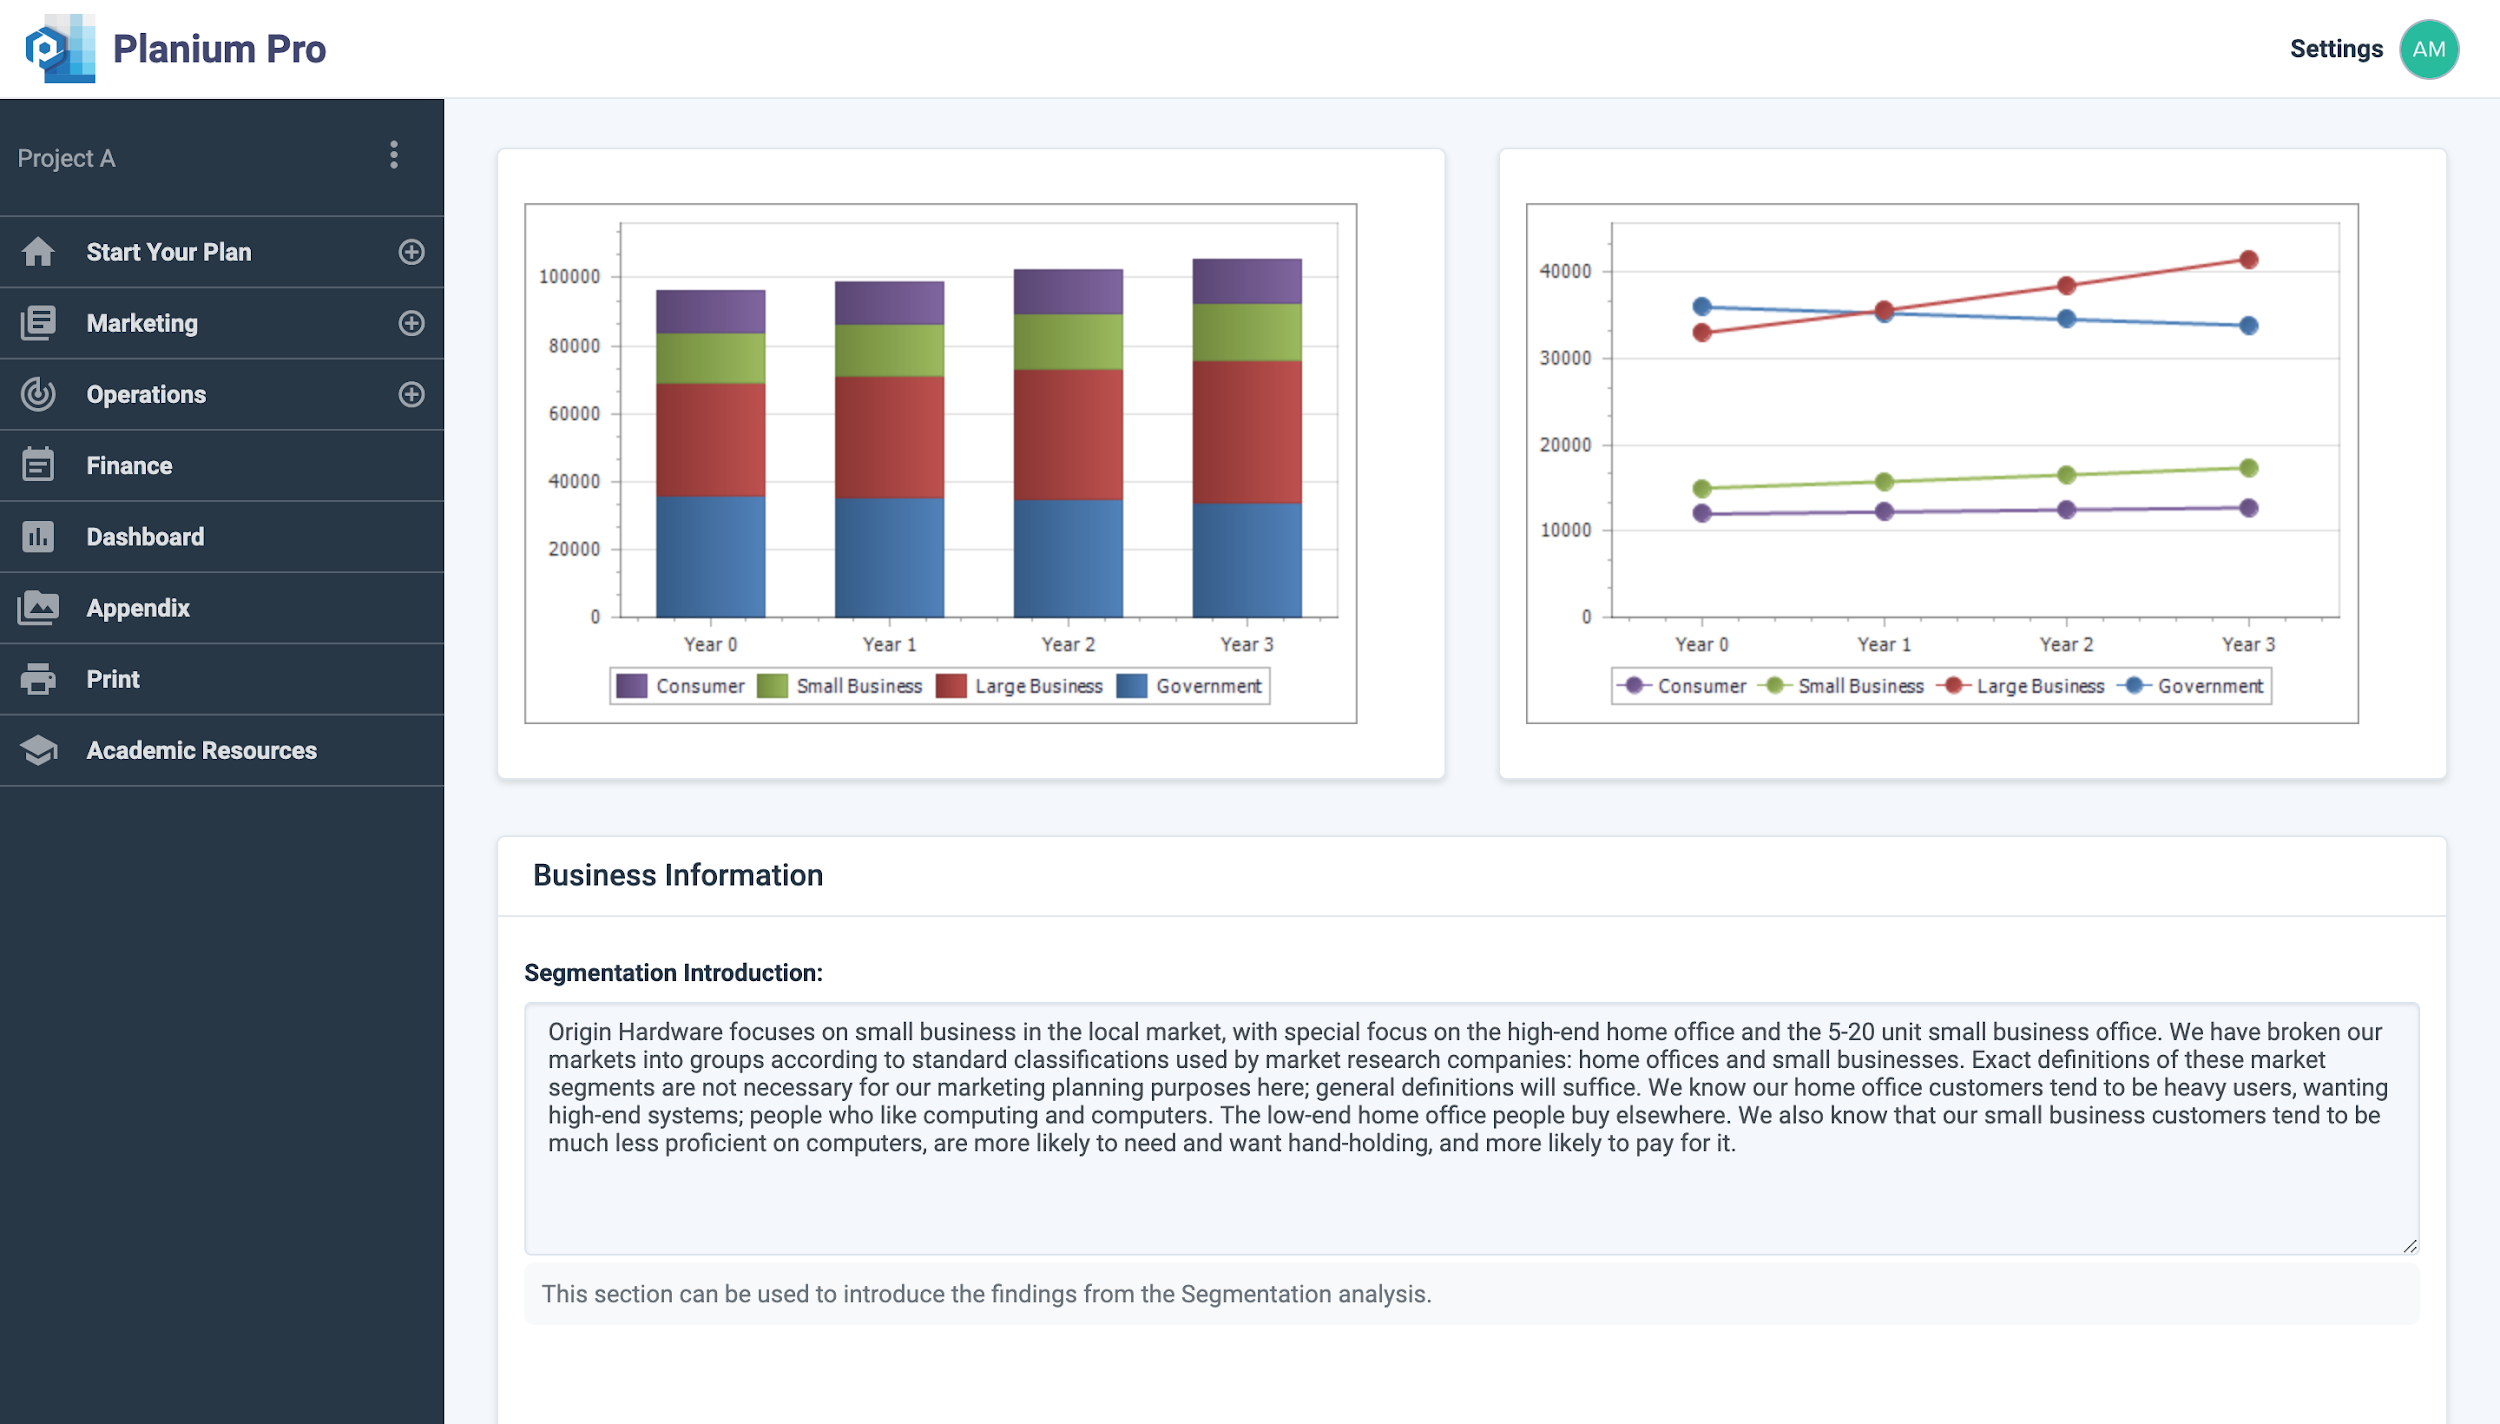
Under ‘Segment Analysis Introduction’, you can input any introductory information that may benefit your client or investor.
‘Analysis Results’ is the section to write-up the analysis on the graph and describe any key themes that are present in the data.
Click ‘Save’ to save changes.
Click ‘Report Preview’ to view the write-up in report format.
3.Operations
This section details the processes and procedures to effectively and efficiently deliver the product or service. Any existing suppliers, equipment, inventory or software should be outlined. The focus in this section is on the implementation aspect of the business plan.
3.1.Routine Processes
Routine Processes
Typically, a company that manages its affairs with regular processes, procedures and communication tend to have lower transaction costs and more efficient way of conducting its business. Processes, procedures and communication are tantamount with management of the business – and should all be focused toward delivering value for the customer.
The key difference between processes and procedures are outlined below:
- A process typically defines what needs to be done, at what time and by what function, it describes the necessary actions and requires having an element of what is called pre-audacity and an element of responsible function. Once the process is determined as per previously mentioned parameters, the question of how it is done is embodied in a procedure.
- A procedure is typically textual, with diagrams, simplified, and explains how to do something. While a process is commonly a diagram that shows what, when and who, a procedure then explains how it is done.
![]()
Using Routine Processes on Planium Pro
To complete this section, on the left-hand side menu bar, click the + to expand the ‘Operations’ menu and select ‘Routine Processes’.
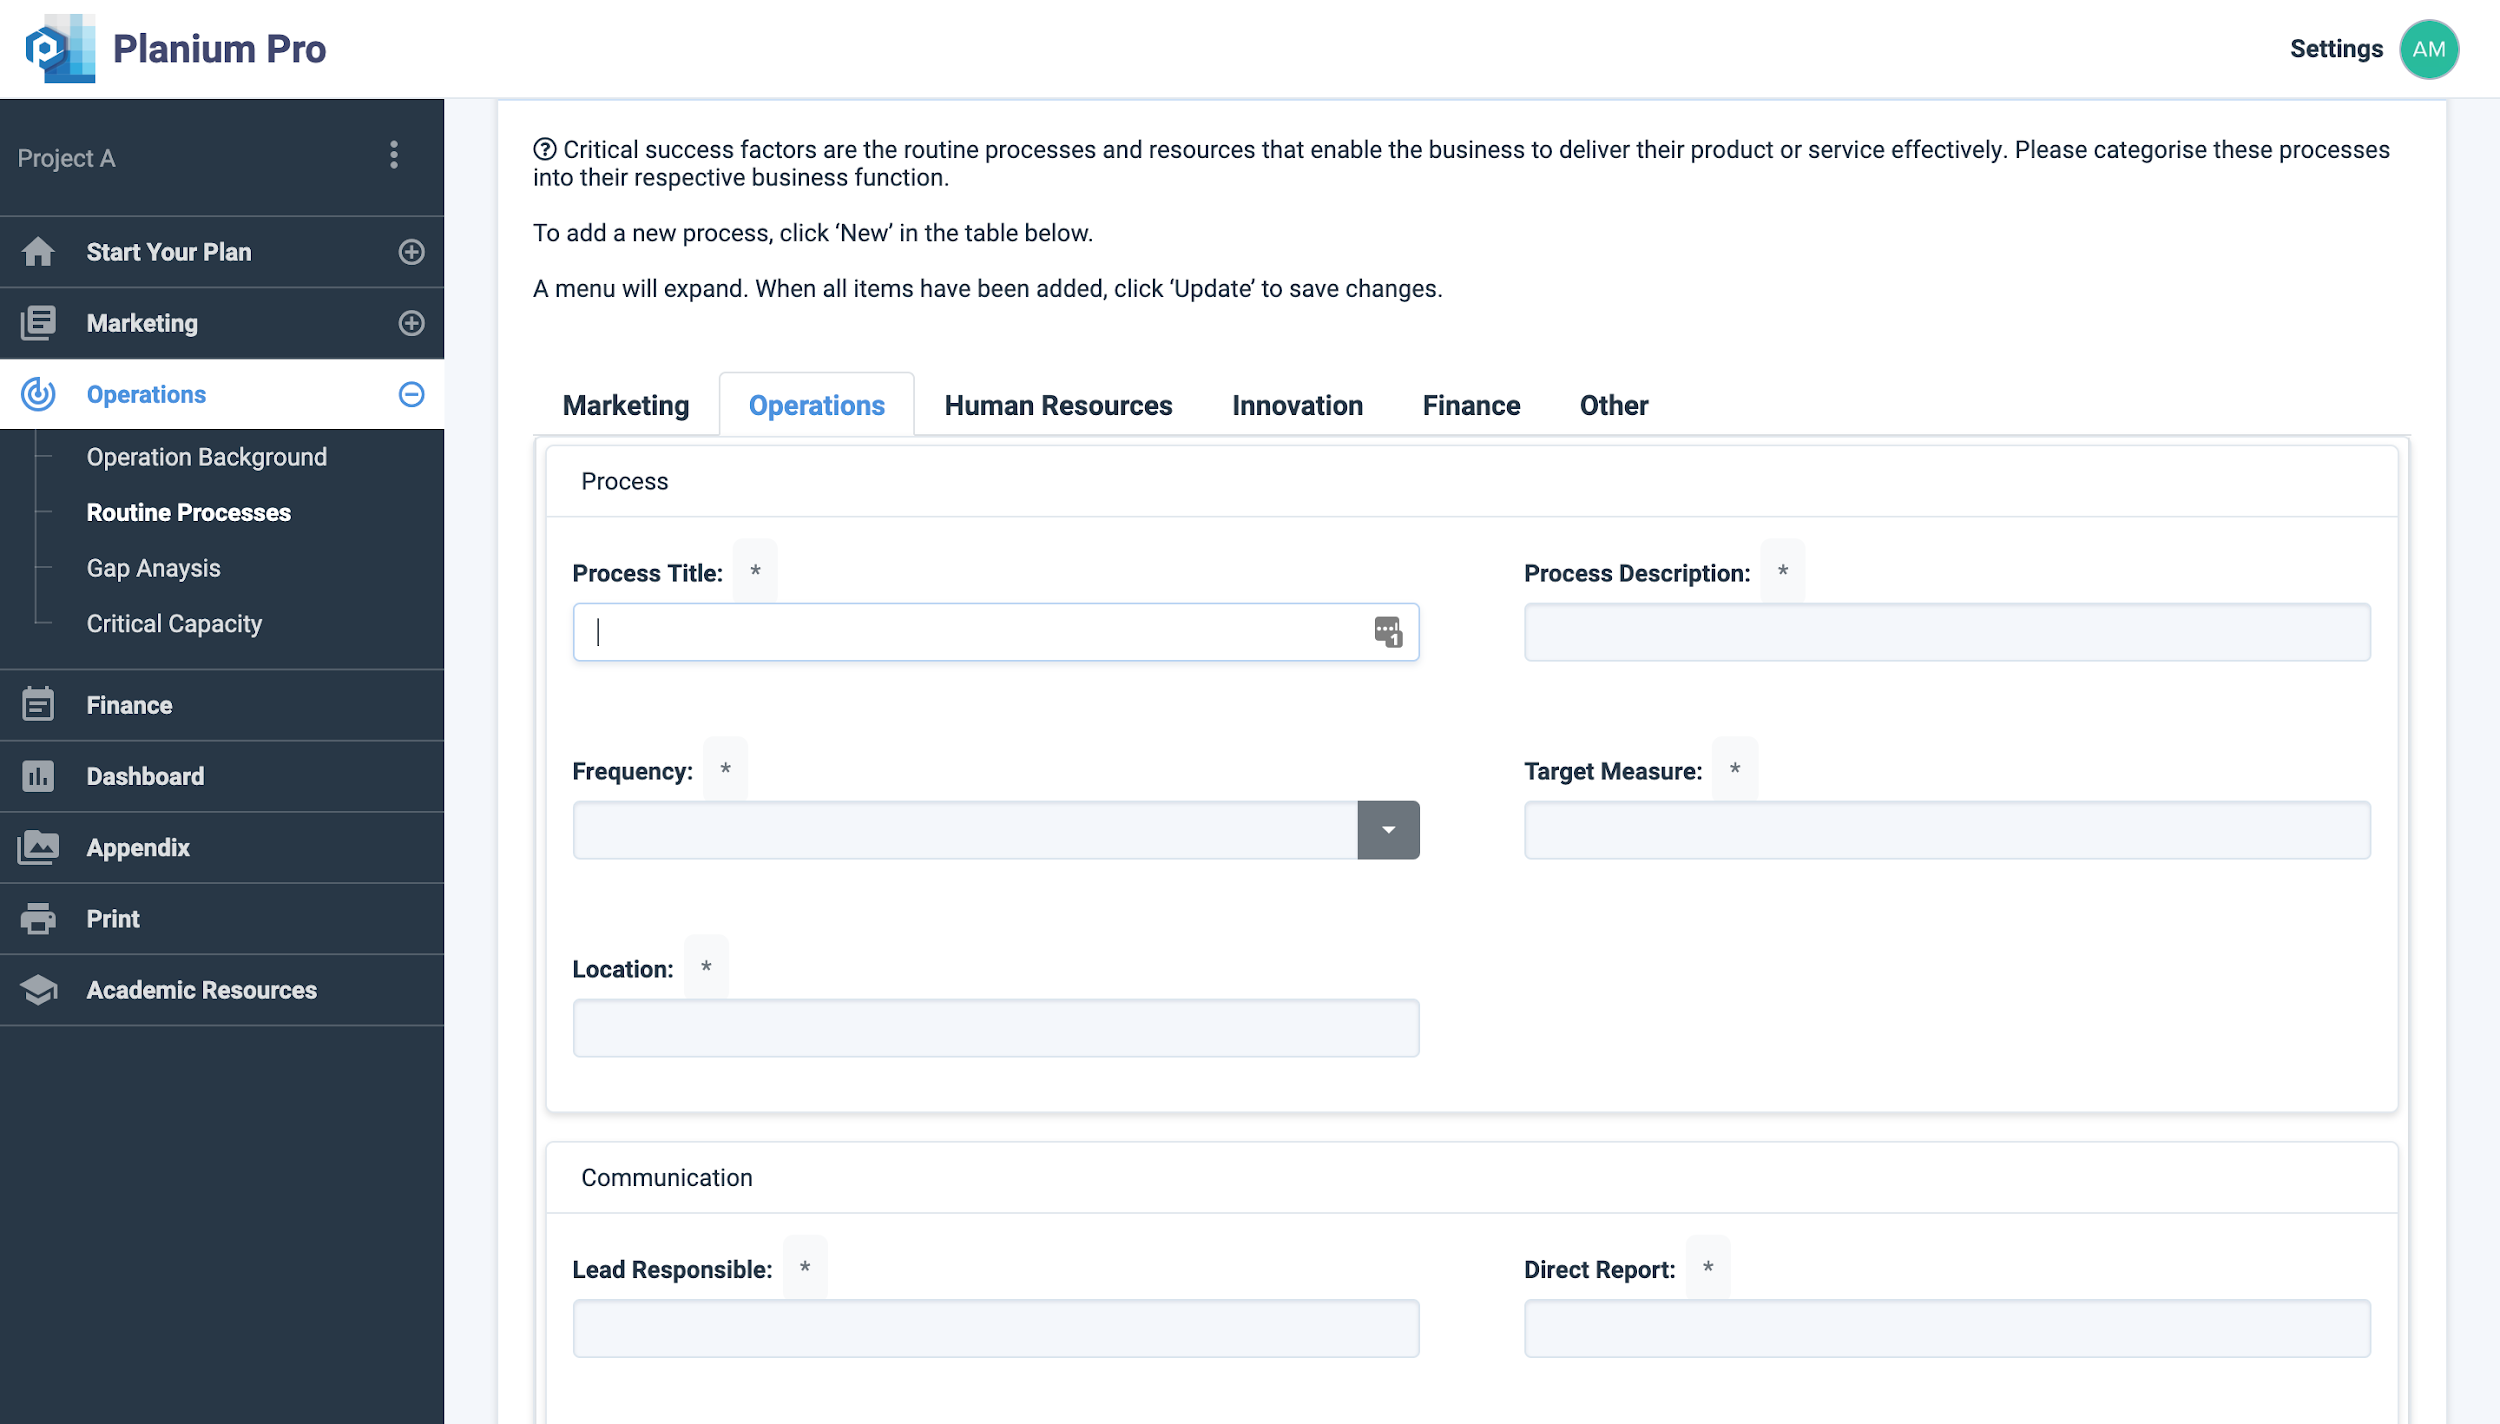
To add a new process, click ‘New’ in the table below and new fields will expand. Record any routine processes under the relevant resource tab.
- Marketing
- Operations
- Human Resources
- Innovation
- Finance
- Other
Click ‘Update’ to save changes.
Click ‘Report Preview’ to view the write-up in report format.
3.2.Gap Analysis
Gap Analysis
Gap analysis is a tool that provides organisations with the information necessary to determine the gap between actual performance (current practices) and potential or desired performance (industry best practices). This information is useful in identifying barriers that need to be addressed before the implementation process and facilitates the improvement of inefficient business processes by optimising allocation of all resources and inputs, which ultimately minimises the gap, allowing the firm to establish a competitive advantage.
Gap analysis can be performed at the macro or micro level and is used in all business areas, for example resource availability, costs control, quality improvement, processes applications, skill augmentation and financial performance.
The gap analysis has four stages:
- Defining the problem or goal the business wants to attain
- Identifying the current state
- Identifying and describing the gap
- Developing strategies (action plan) to close the gap.
Listed below are a few questions that might be useful to consider:
- Where does the business have a gap?
- What are the consequences of the gap?
- Can the gap be closed?
- What are the options?
Using Gap Analysis on Planium Pro
To complete this section, on the left-hand side menu bar, click the + to expand the ‘Operations’ menu and select ‘Gap Analysis’.
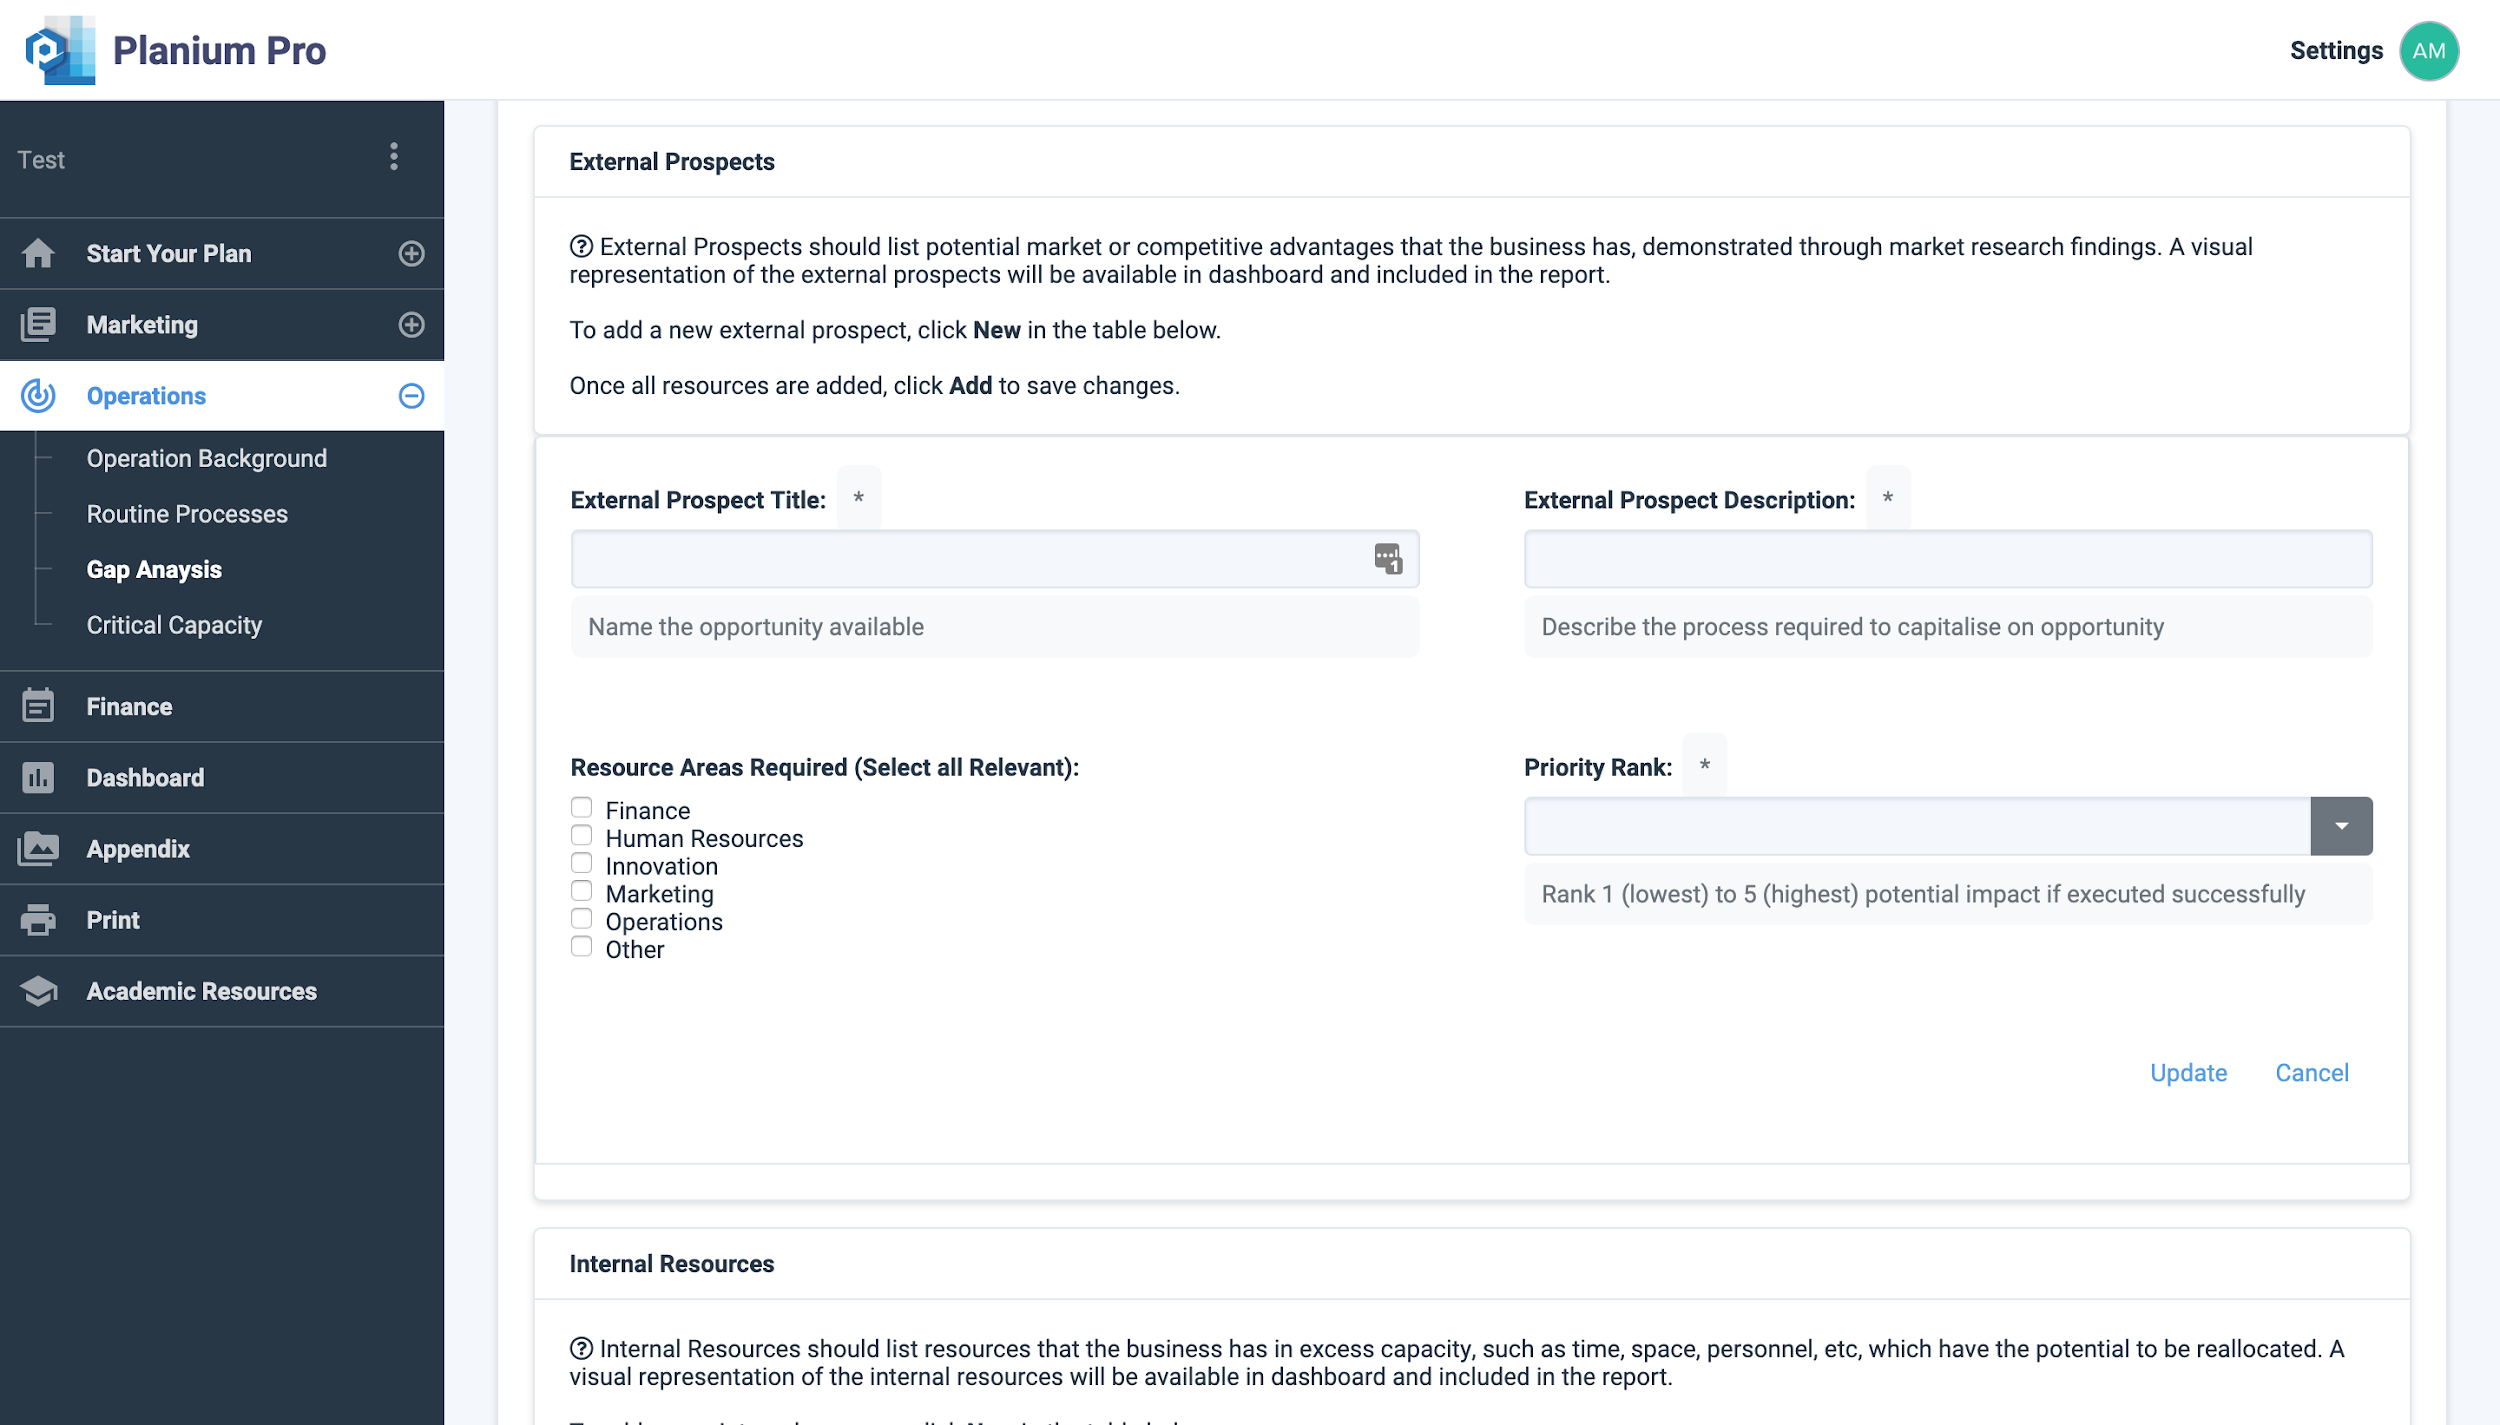
External Prospects
List the external prospects you have identified through marketing research or other methods where your business/project could potentially create market/competitive advantage. Evaluate any resource mismatches by identifying the processes required to execute the opportunity and provide a priority rank to the external opportunity’s potential impact if executed.
- A visual representation of your external prospects will be available in dashboard and included in your report.
Click ‘Add’ to save changes.
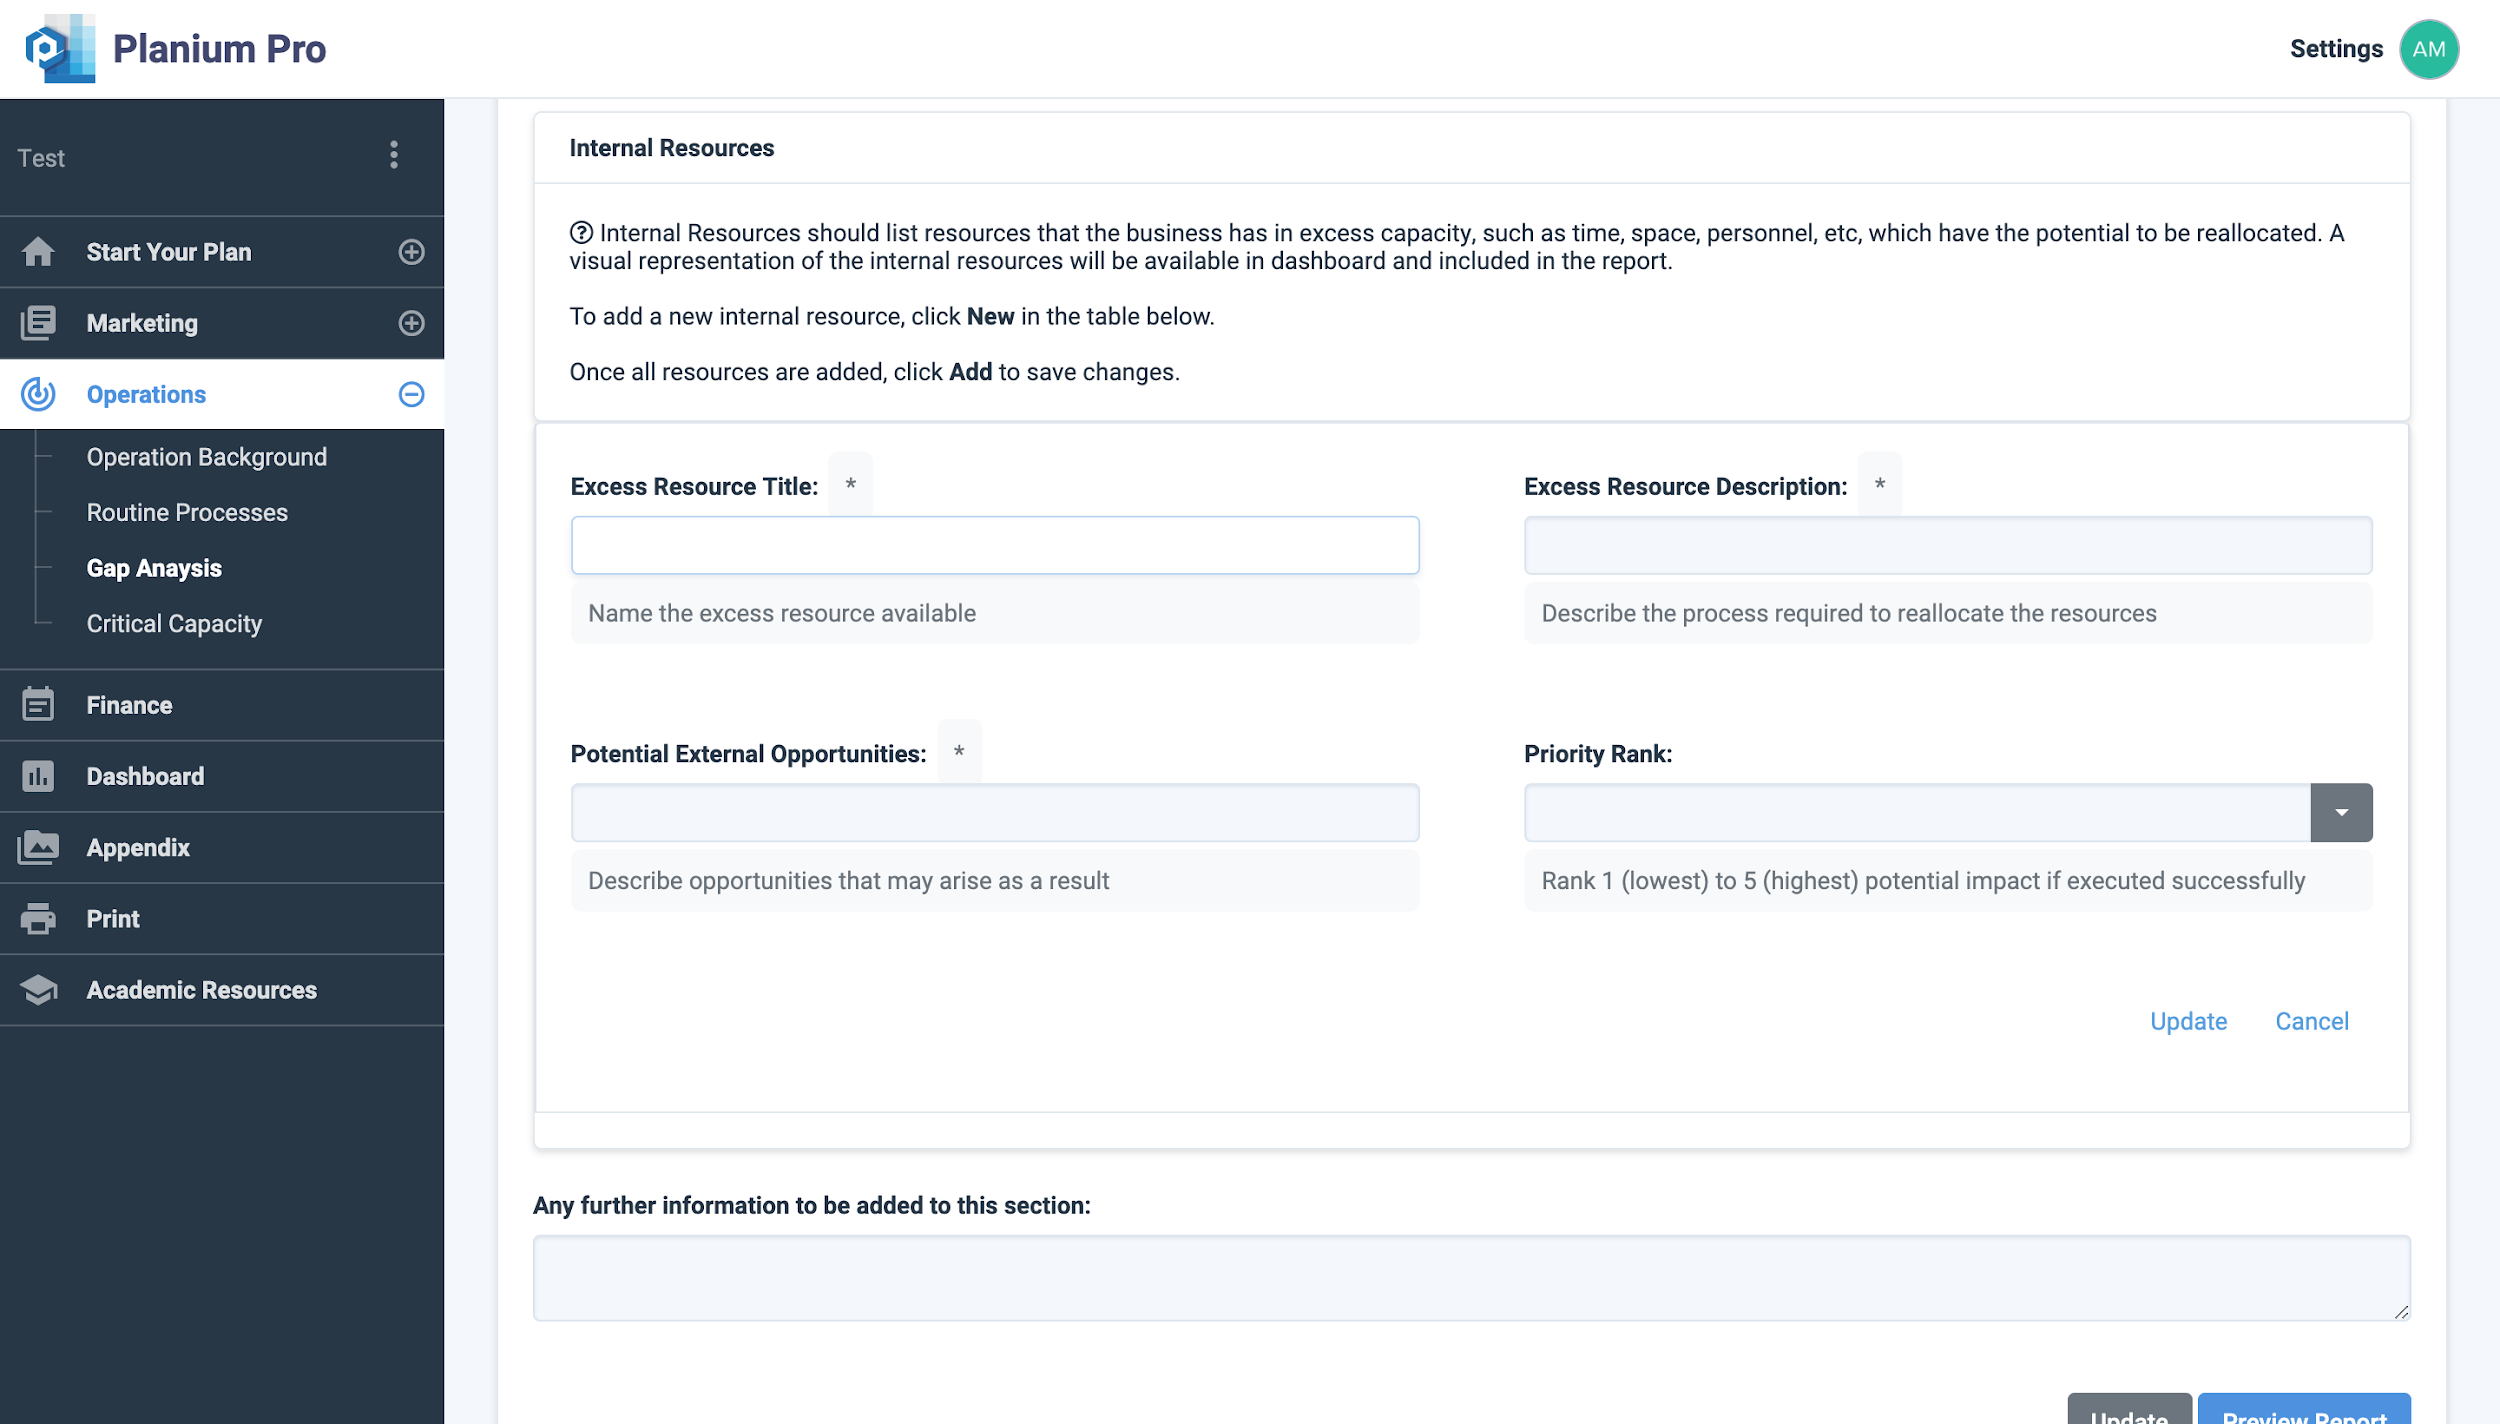
Internal Resources
Evaluate and list any resources/assets that your business/project has in excess capacity. These resources may not necessarily be utilized immediately as suitable market conditions may not exist. In this case, formulation of step-change programs would assist in readiness for entry into future market opportunities.
- A visual representation of your external prospects will be available in dashboard and included in your report.
Click ‘Add’ to save changes.
Click ‘Update’ to save changes and complete process.
Click ‘Report Preview’ to view the write-up in report format.
4.Finance
Finance
The financial plan examines if the organisations implementation and execution of its strategies are contributing to the bottom-line improvement of the company. The financial plan is a tool that allows firms to evaluate current and future financial performance to ensure it has the adequate amount of capital and capital structure to meet financial requirements, including making strategic decisions about the business’ goals and objectives.
The goal of an organisation is to maximise profit, which is equal to revenue minus cost. Economic agents have an objective that they are trying to optimise:
- Individuals assumed to maximise utility;
- For-profit firms maximise profits or minimise costs; and
- Not-for-profits may maximise output levels.
Decision makers need to have a good understanding of what are the key drivers for their revenue sources and cost of providing the good or service.
The purpose of financial analysis is to establish a proper basis for comparison, in order to determine if the organisation has performed at an expected level. The Planium Pro finance module has eight strategic steps:
- Setup
- Opening Position
- Sales & Direct Costs
- Overheads
- General Assumption
- Capital Expenditure
- Valuation
- Case Sensitivity
- Notes
- Benchmark
To complete this section, on the left-hand side menu bar, click ‘Finance’.
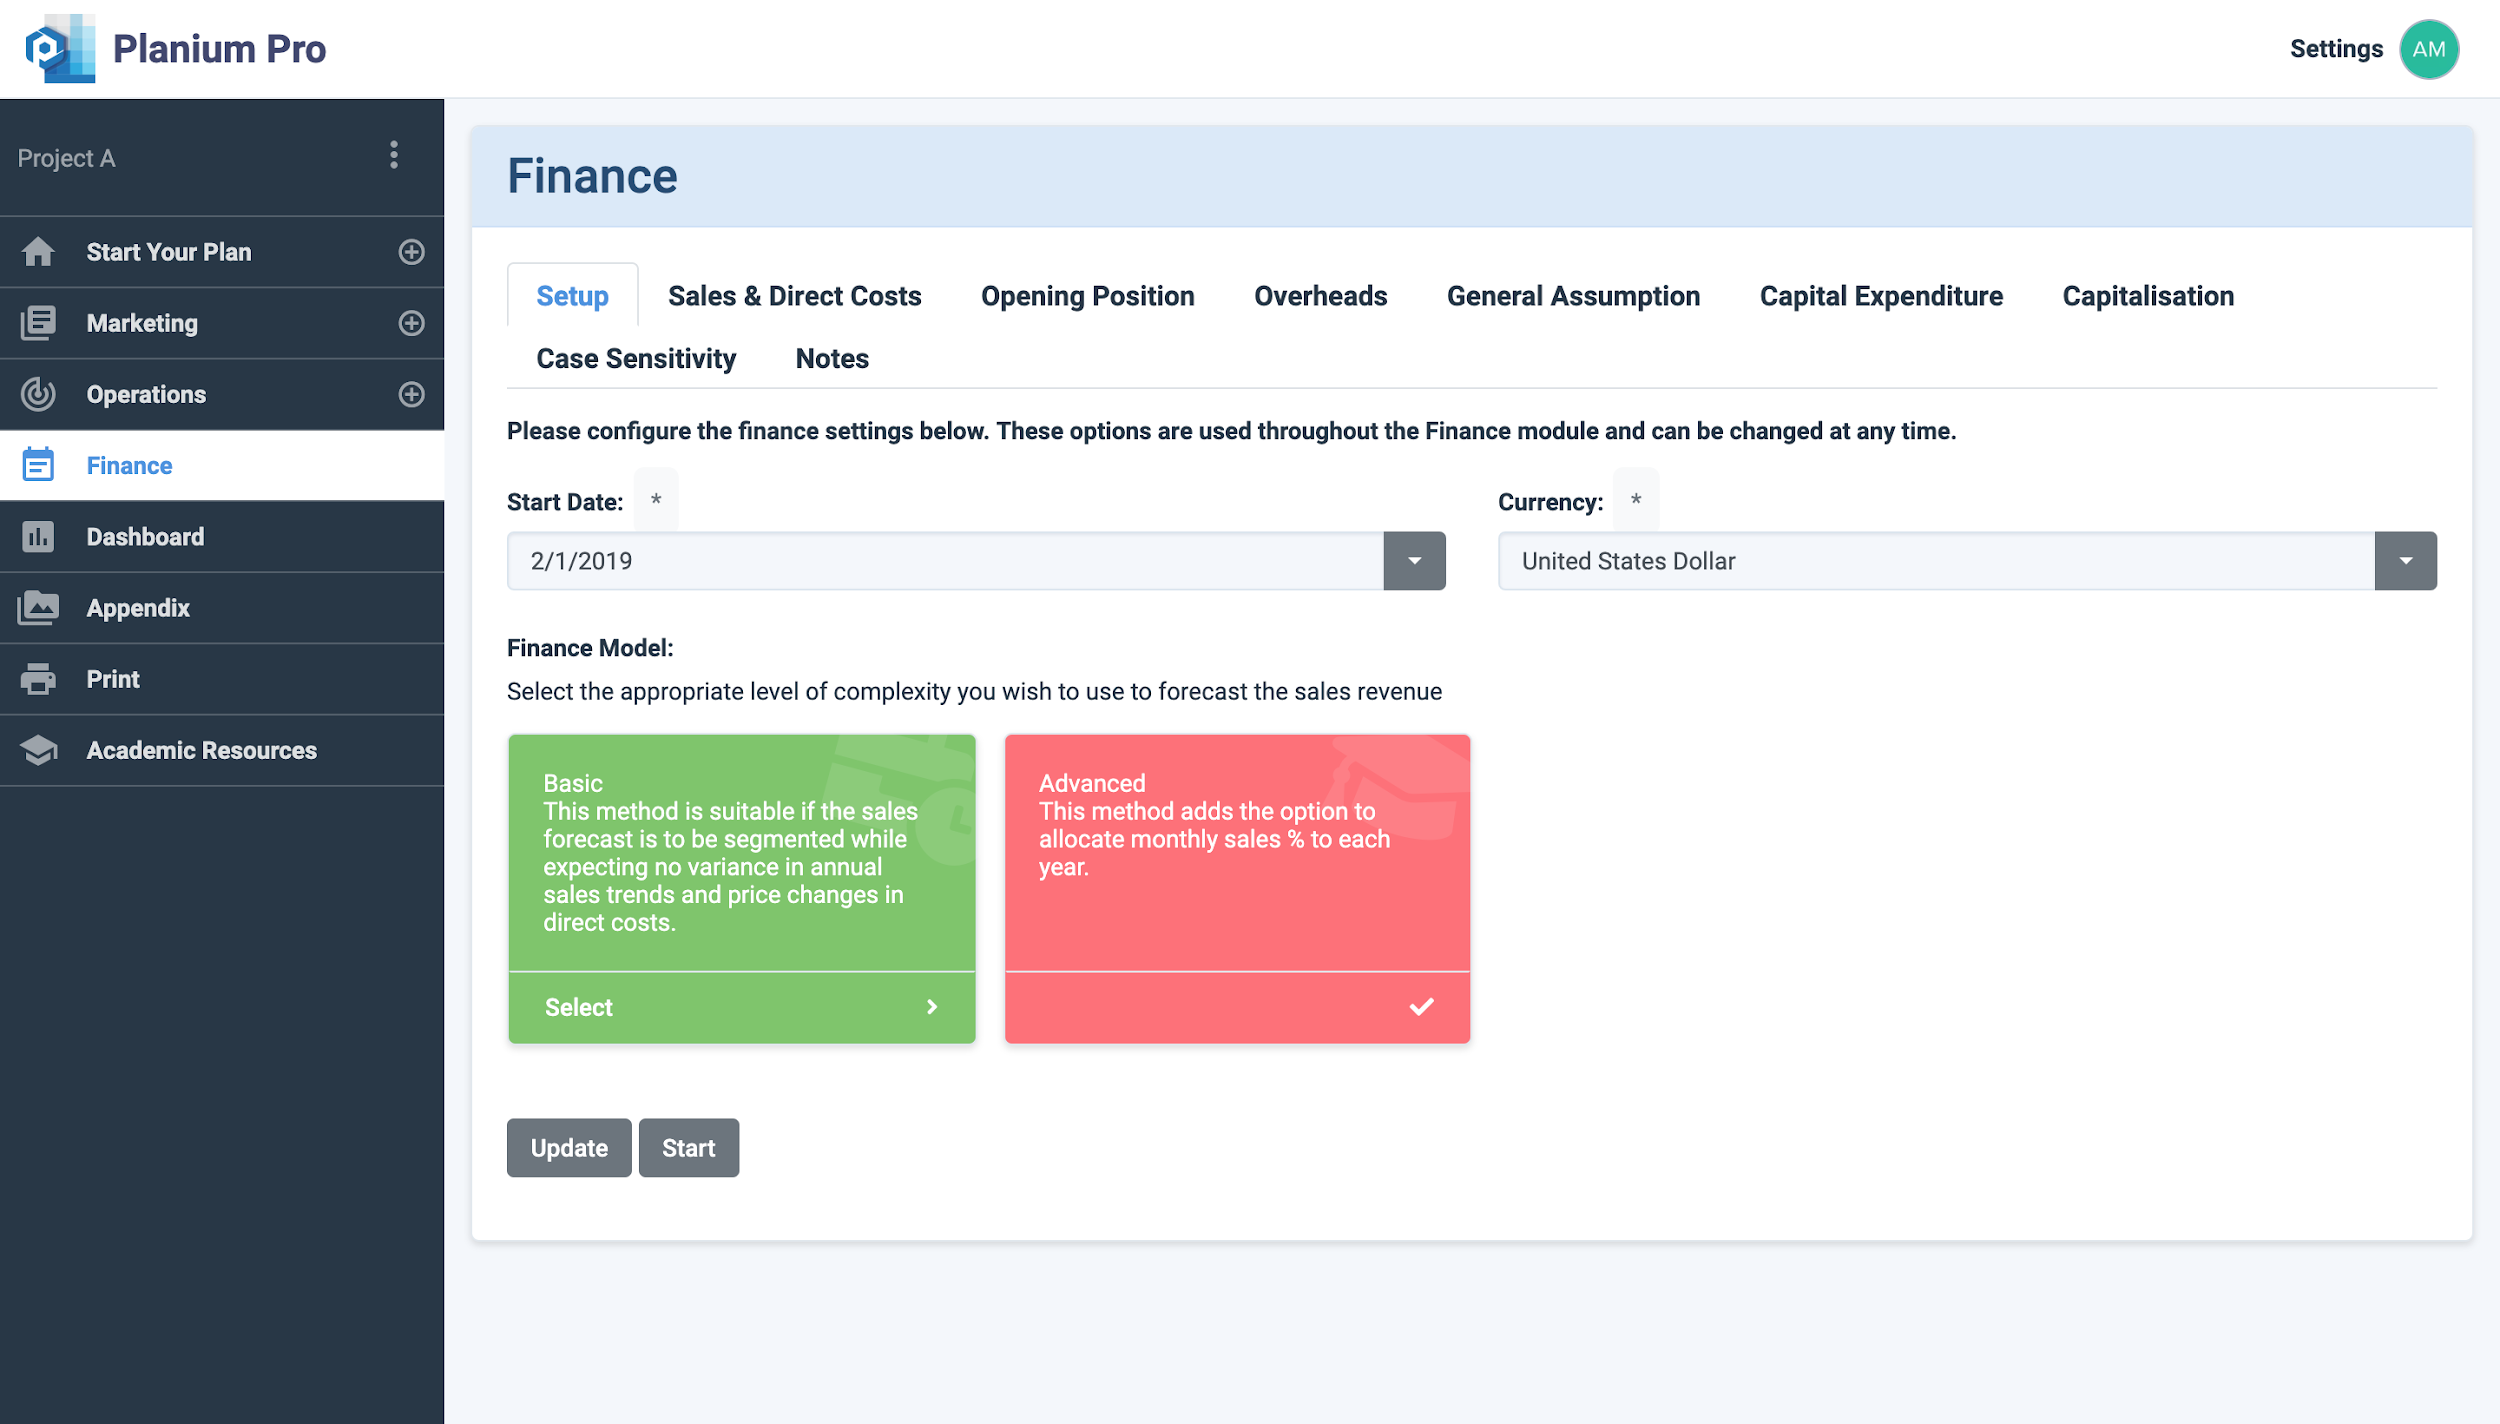
Use the selections to configure the finance settings below. These options are used throughout the Finance module and can be changed at any time.
- Start Date
- Currency
The next decision is the Finance Model which determines the level of complexity you wish to use to forecast the sales revenue. There are two options to select from:
- Basic: This method is suitable if you wish to segment your sales forecast while expecting no variance in annual sales trends and price changes in direct costs.
- Advanced: This method adds the option to allocate monthly sales % to each year.
Click ‘Update’ to save changes.
Click ‘Start’ to start the financial section.

Sales: Enter the forecast annual sales for each segment
Phase: Enter the expected monthly sales breakdown as a percentage of the annual revenue so it equals 100%.
Direct costs: Enter the expected variable costs (Material, Labour, Other) as a percentage of the annual sales forecast for all the years.
Click ‘Save Changes’ at each table to save any changes made.
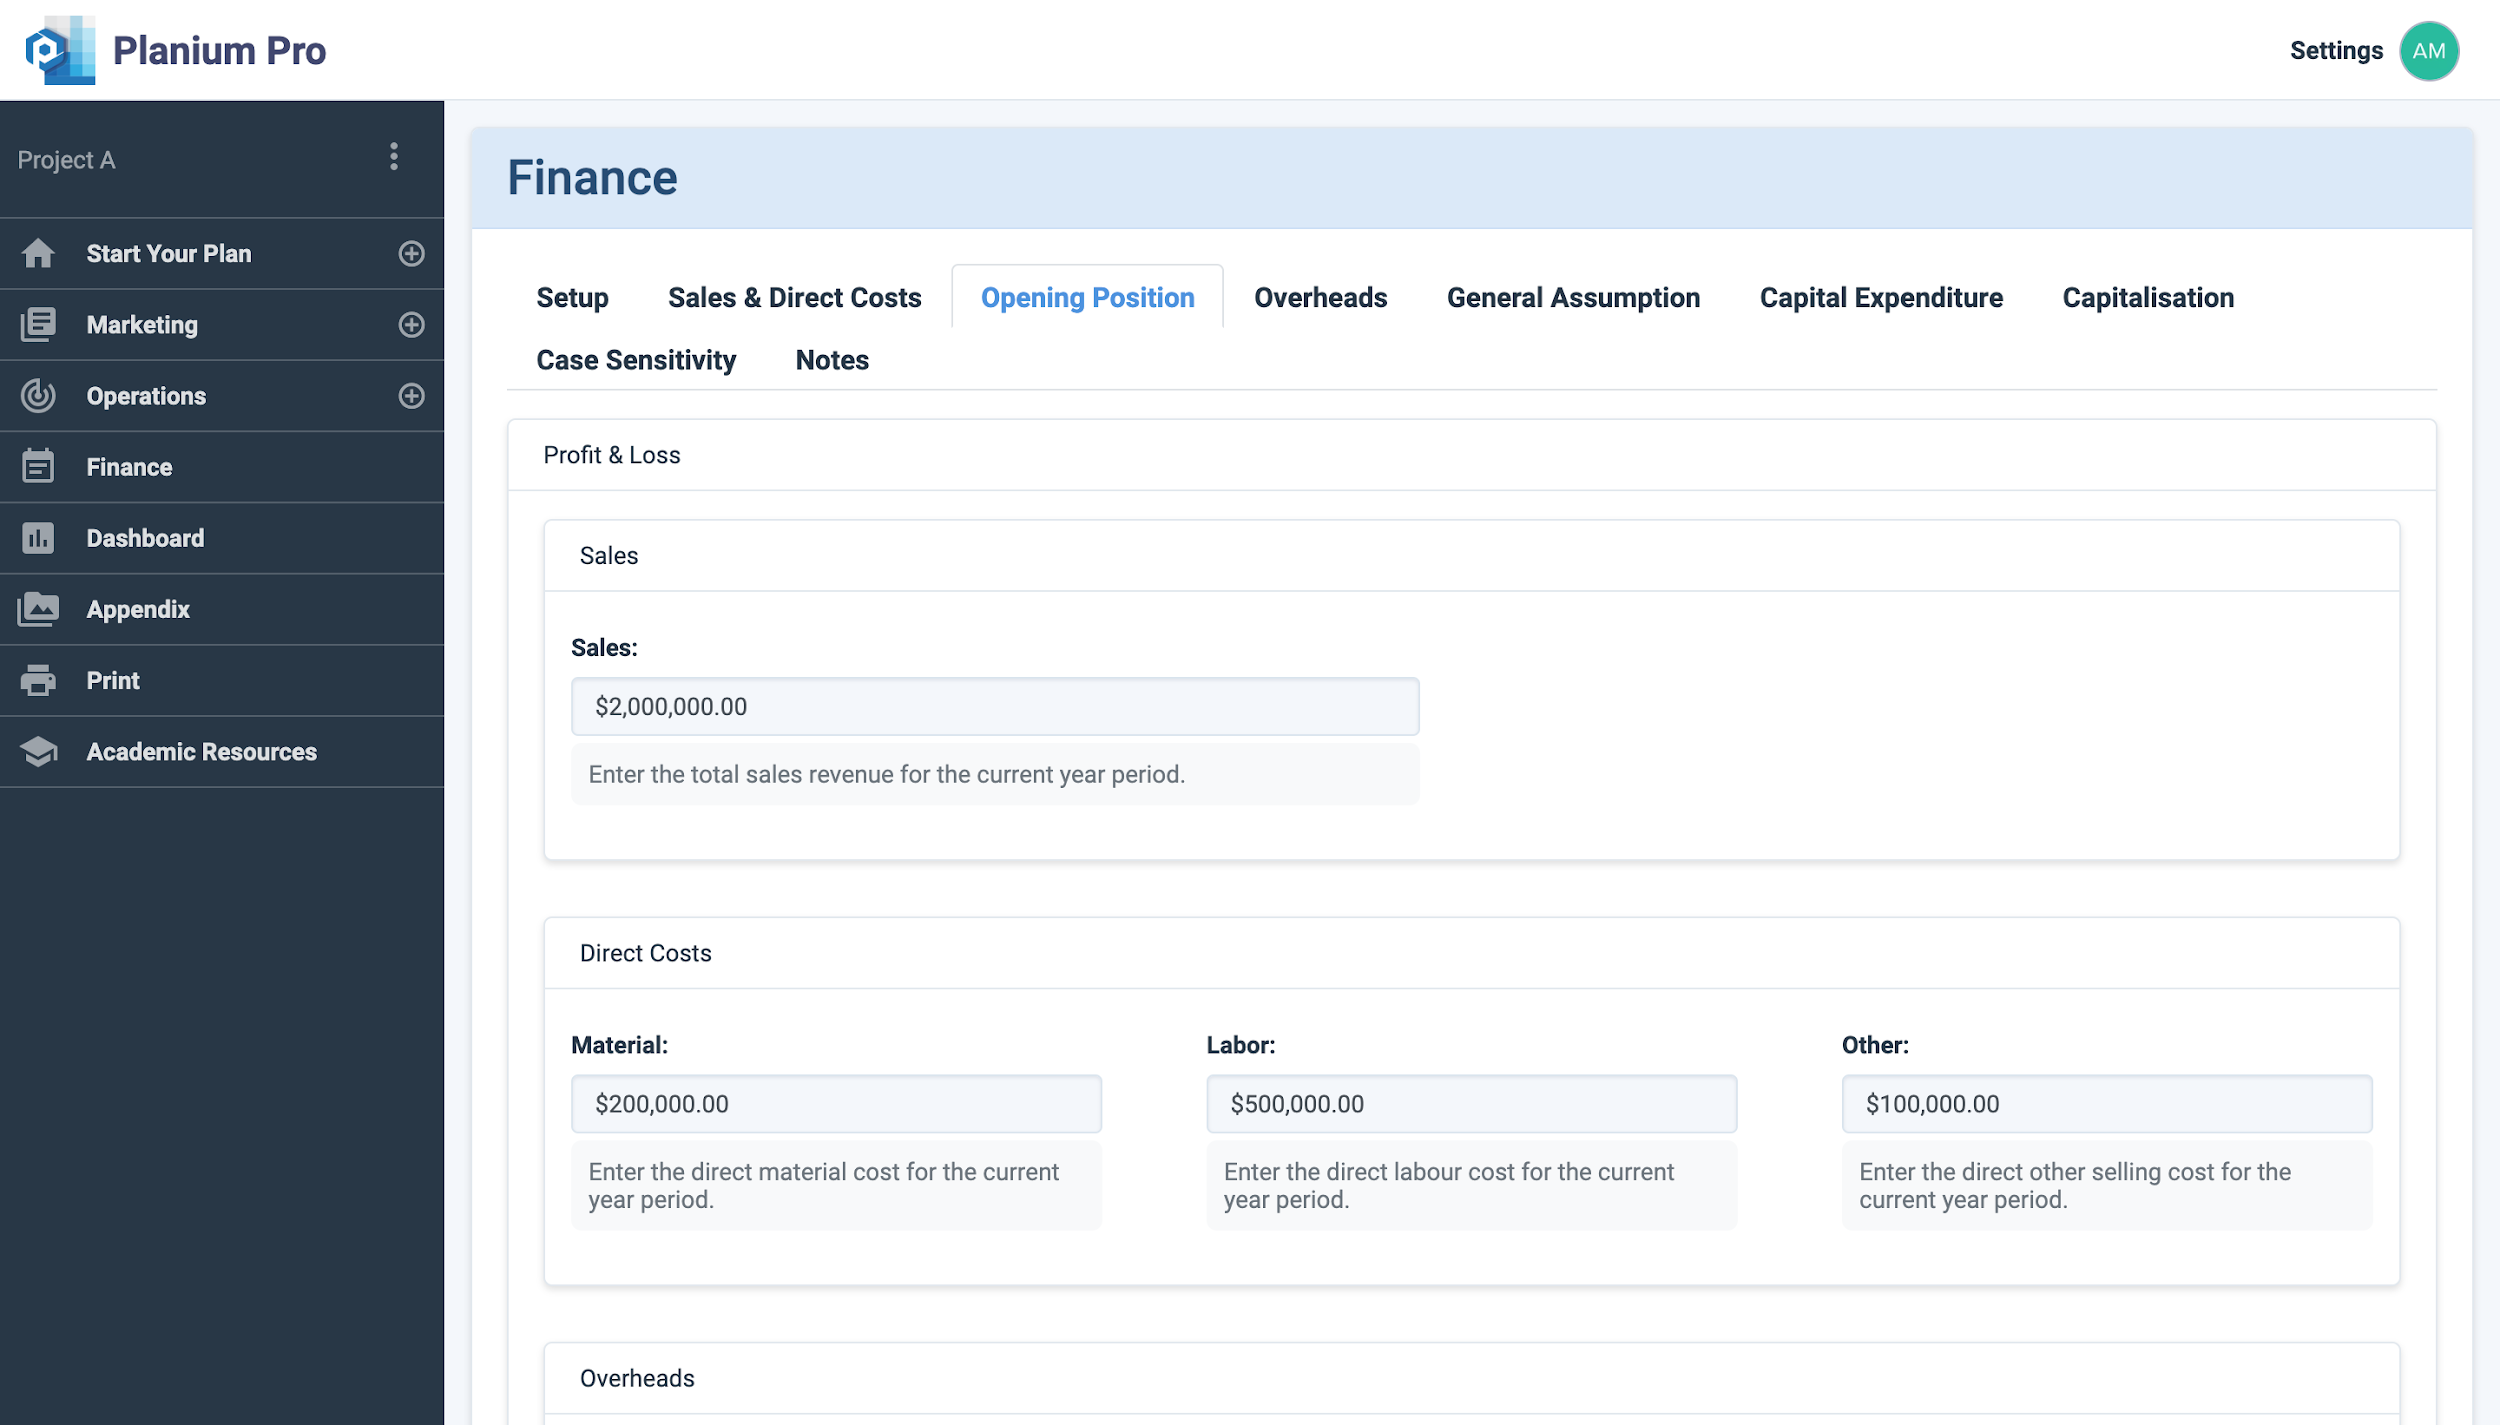
To complete this section, in the menu across the top of your screen, select ‘Opening Position’.
Profit & Loss:
- Sales: Enter the total sales revenue for the current year period.
- Direct costs:
- Material: Enter the direct material cost for the current year period.
- Labor: Enter the direct labour cost for the current year period.
- Other: Enter the direct other selling cost for the current year period.
- Overheads:
- Admin & HR: Enter the administrative, office supplies, legal and payroll costs, etc. for the current year period.
- Rent & Equipment Expense: Enter the rent and equipment leasing costs for the current year period.
- Maintenance: Enter the maintenance, uncapitalized repair and utility services costs for the current year period.
- Marketing: Enter the marketing costs for the current year period.
- R&D / Others: Enter the uncapitalized research and development costs for the current year period.
- Depreciation Expenses: Enter the amount of depreciation expensed against depreciable fixed assets for the current year period.
- Gain/Loss on Fixed Assets Disposal: Enter the balance (+/-) for gains and impairments resulting from the disposal of fixed assets at net book value for the current year period.
- Interest Expense: Enter interest paid on debt and finance leasing activities for the current year period.
- Tax Expense: Enter the tax remitted for the current year period.
- Profit/(Loss): Your total Profit/Loss is calculated using values entered above. Check this is correct before continuing.
Balance Sheet
- Current Assets
- Cash on Hand: Enter the current combined cash balance, including held on site cash and petty cash, or overdraft (enter as negative).
- Accounts Receivables: Enter the current receivables balance owing from trade debtors you sold goods to or performed a service for.
- Inventories: Enter the current net realisable value or lower of cost value for the combined raw, in progress and finished goods inventory.
- Non-Current Asset
- Plant & Equipment: Enter the current net book value of plant, machine and equipment.
- Motor & Transport Vehicle: Enter the current valuation for vehicles under ownership.
- Property: Enter the current valuation or net book value for land and or buildings under ownership.
- IT & Computer: Enter the current valuation or net book value any IT or Technology assets.
- Other: Enter current net book value of all other fixed assets.
- Current Liabilities
- Accounts Payable: Enter the current payables balance owing to trade creditors that from which you purchased goods or services.
- Loans (Short Term): Enter the current amount payable for short-term financing activities.
- Non-Current Liabilities
- Loans (Long Term): Enter the current value of debt payable in more than 12 months’ time.
- Equity
- Shareholders’ Equity: Enter the current balance of invested equity capital.
- Retained Earnings: Enter the current accumulated earnings or losses (enter as negative) including reserves.
- Issued Shares: Enter the number of ownership shares issued, except partnership and sole trader enter ‘0’.
Click ‘Update’ to save changes.
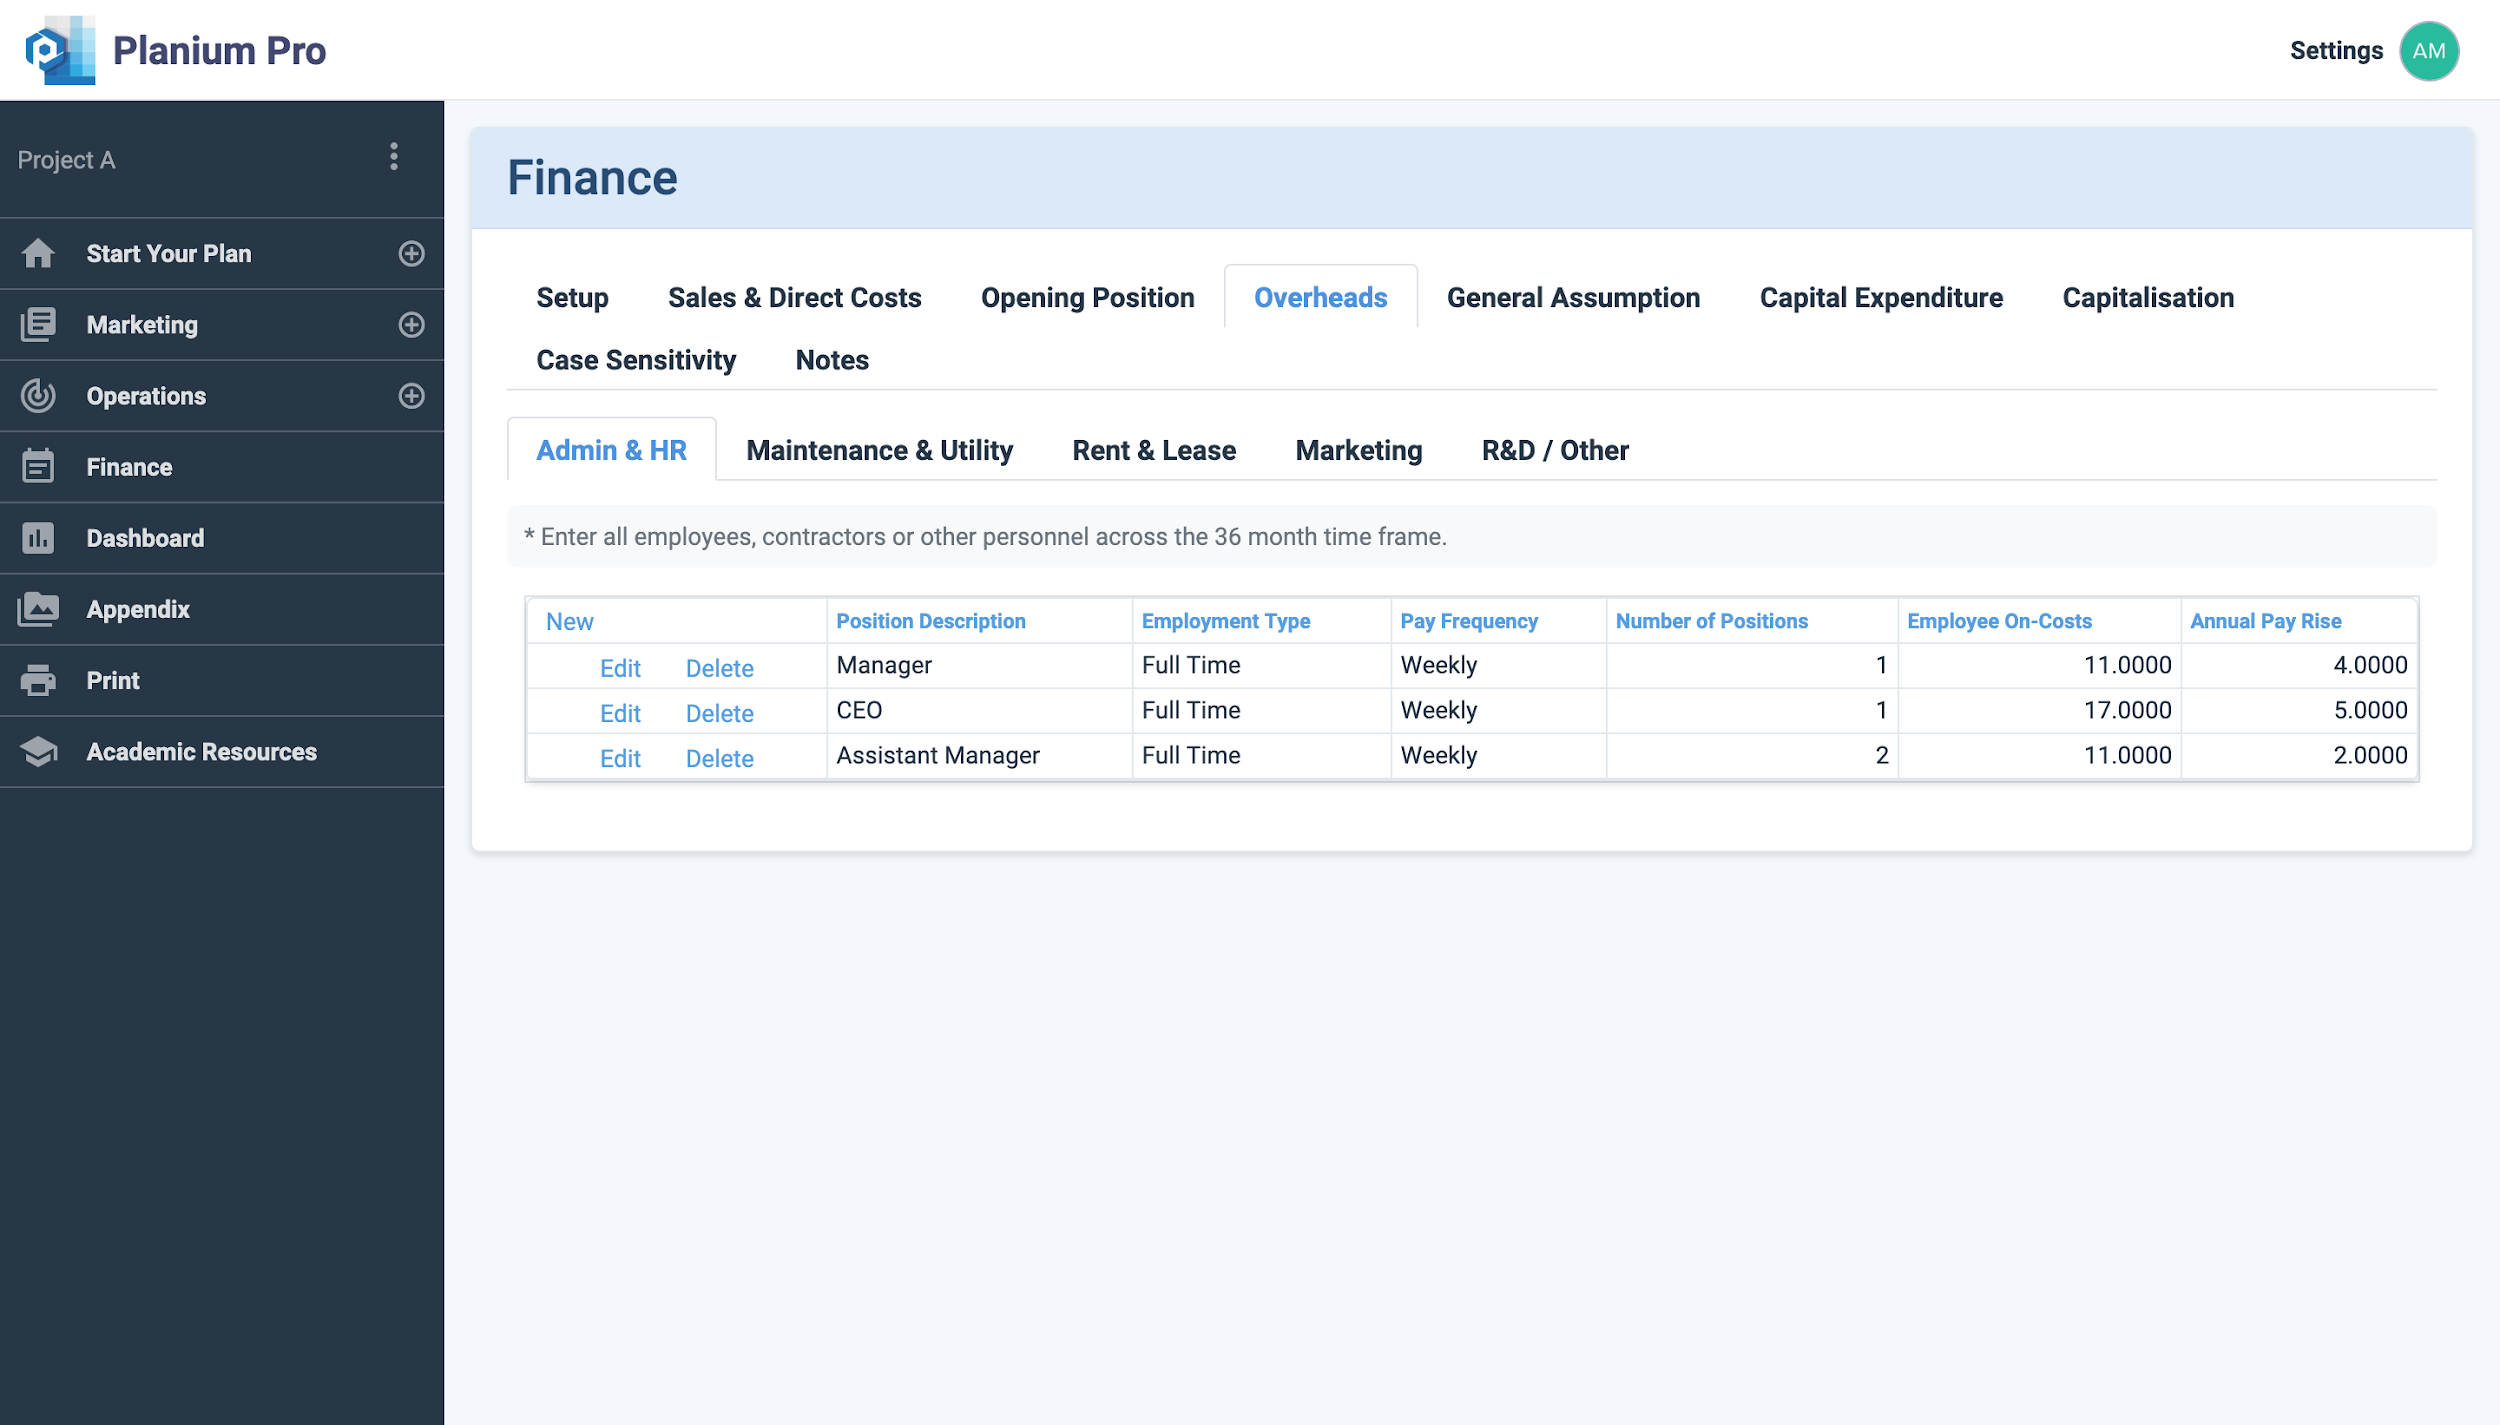
To complete this section, in the menu across the top of your screen, select ‘Overheads’.
Admin & HR: Enter all employees, contractors or other personnel across the 36 month time frame. Include their name, position description, employment type, pay frequency, number of positions, and employee on-costs.
Maintenance & Utility: Enter monthly maintenance and utility expenses that are anticipated across the 36 month time frame.
Rent & Lease: Enter monthly rent and lease expenses that are anticipated across the 36 month time frame.
Marketing: Enter monthly marketing expenses that are anticipated across the 36 month time frame.
R&D / Other: Enter monthly R&D and Other expenses that are anticipated across the 36 month time frame.
Click ‘Update’ to save changes.
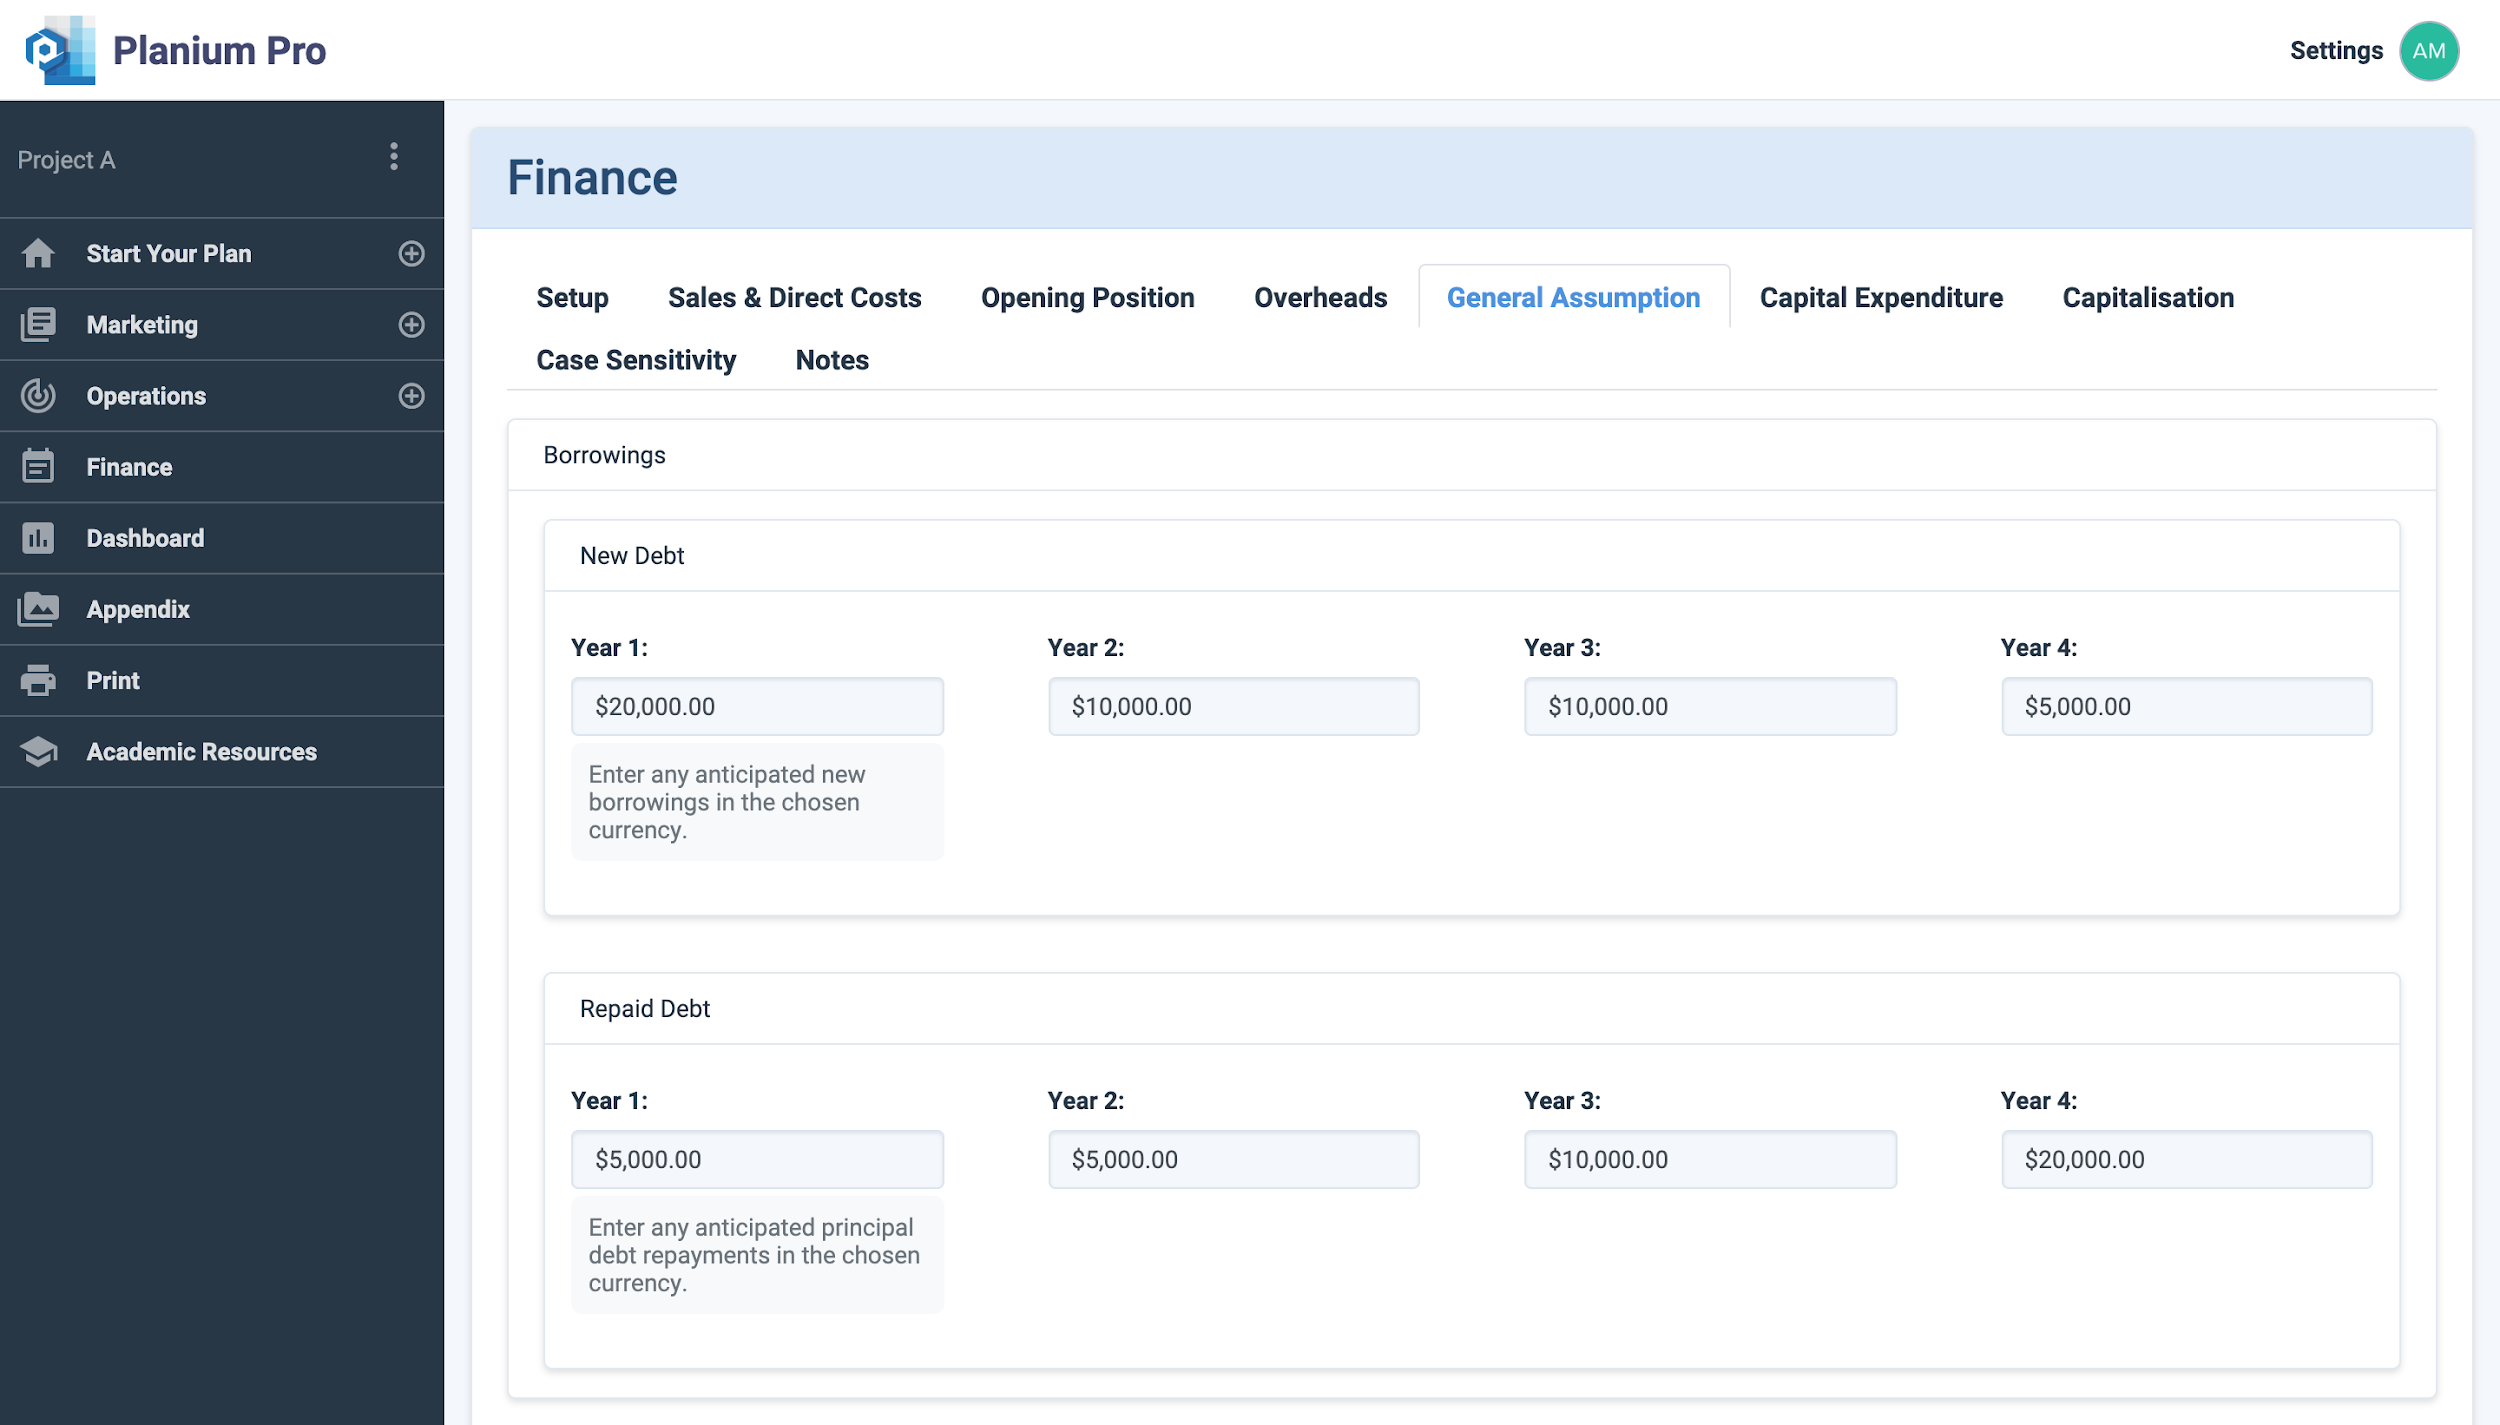
To complete this section, in the menu across the top of your screen, select ‘General Assumption’.
Borrowings
- New Debt: Enter any anticipated new borrowings in the chosen currency.
- Repaid Debt: Enter any anticipated principal debt repayments in the chosen currency.
Stock/Inventory Days
- Finished Goods Stock (Days): Enter average days finished goods are held in inventory before they are sold.
- Raw Material Inventory & WIP (days): Enter average days raw materials and work in progress goods are held in inventory before converted to finished goods.
Divine/Contributed
- Income Tax Rate: Enter company tax rate or effective marginal tax rate (if not company).
- Interest Rate: Enter anticipated effective cost of borrowings.
- Consumption Tax: Enter the GST or VAT rate that applies to your locality.
- Return On Equity: Enter the expected rate of return on capital invested.
Shareholders’ Contributions
- Enter any anticipated equity contributions in the chosen currency (Year 1 to 4)
Dividend Payout
- Enter any anticipated dividend disbursements in the chosen currency.
Depreciation Rate
- Plant & Equipment: Enter the depreciation rate applied to plant and equipment.
- Motor and Transport Vehicle: Enter the depreciation rate applied to motor vehicles.
- Buildings: Enter the depreciation rate applied to buildings and facilities.
- Information Technology: Enter the depreciation rate applied to information technology assets.
- Other: Enter the depreciation rate applied to all other assets.
Accounts Receivable Days
Enter as percentages the anticipated proportion of receivables collected within a specific period. Cannot equal more than 100% and any less the remainder would be treated as cash sale.
- Within One Month
- Within Two Months
- Three Months or Longer
Accounts Payable Days
Enter as percentages the anticipated proportion of payables disbursed within a specific period. Cannot equal more than 100% and any less the remainder would be treated as cash purchase.
- Within One Month
- Within Two Months
- Three Months or Longer
Click ‘Update’ to save changes.
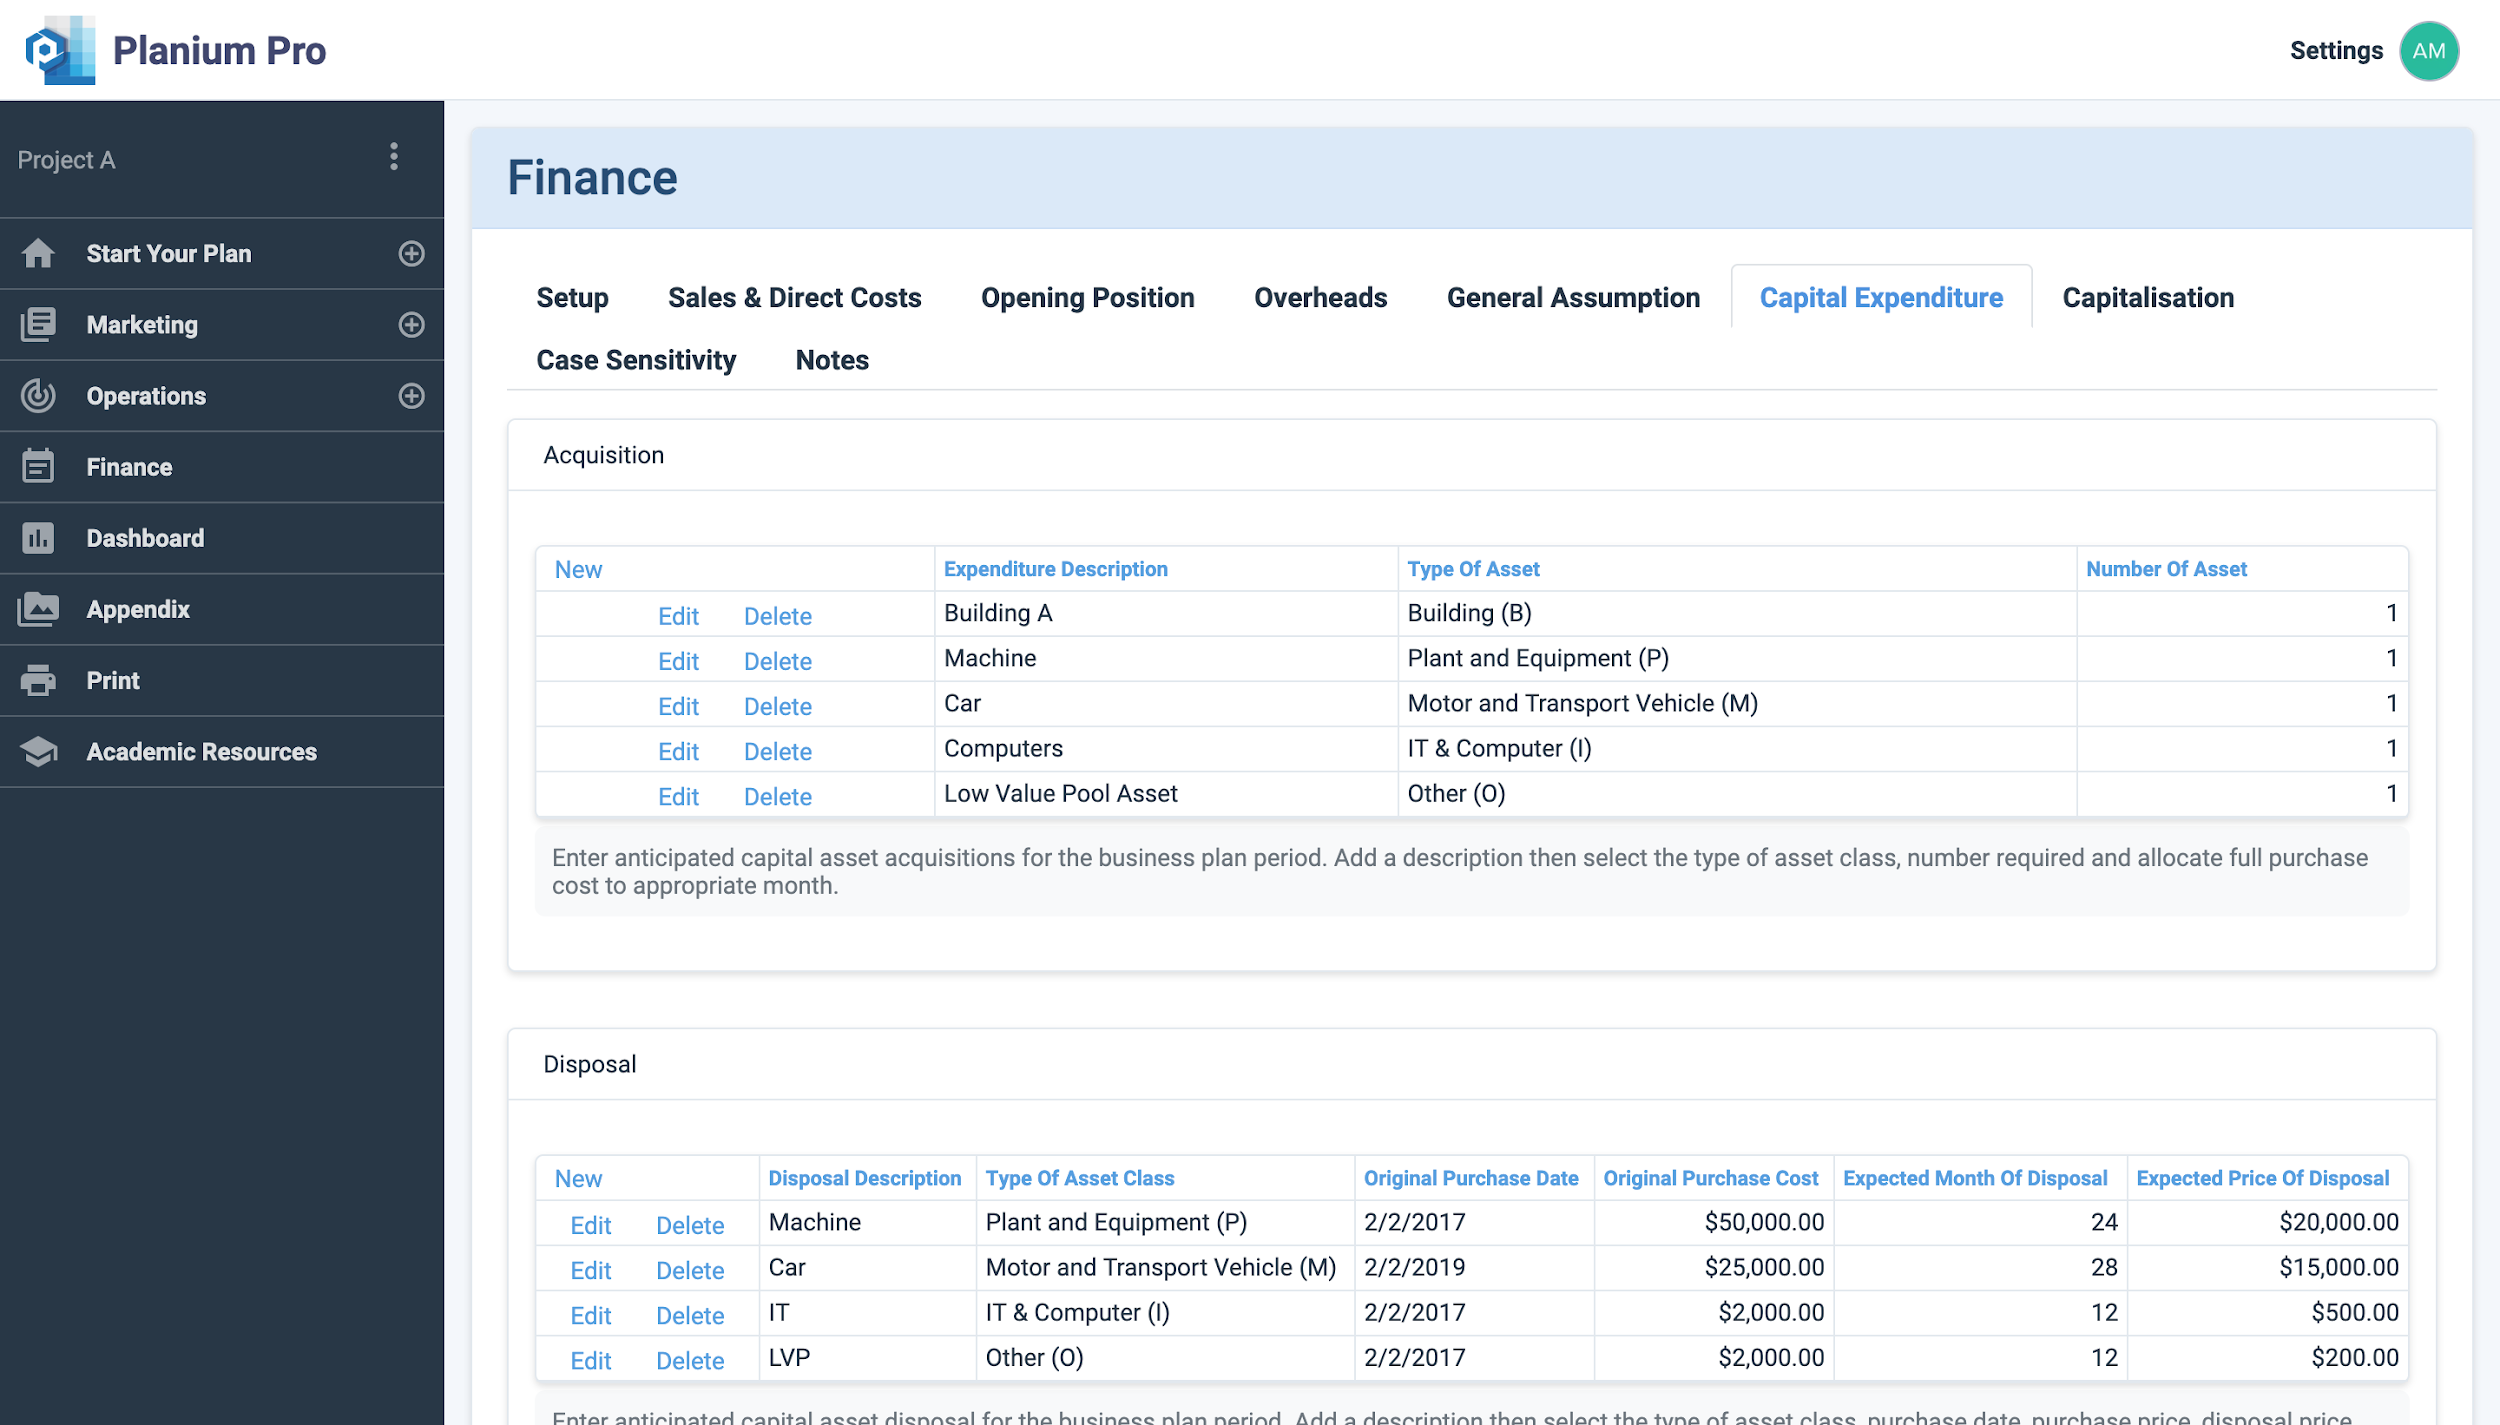
To complete this section, in the menu across the top of your screen, select ‘Capital Expenditure’. Click ‘New’ in the top left corner of each table to add a new expenditure.
- Acquisitions: Enter anticipated capital asset acquisitions for the business plan period. Add a description then select the type of asset class, number required and allocate full purchase cost to appropriate month.
- Disposal: Enter anticipated capital asset disposal for the business plan period. Add a description then select the type of asset class, purchase date, purchase price, disposal price and month of disposal.
Click ‘Update’ to save changes.
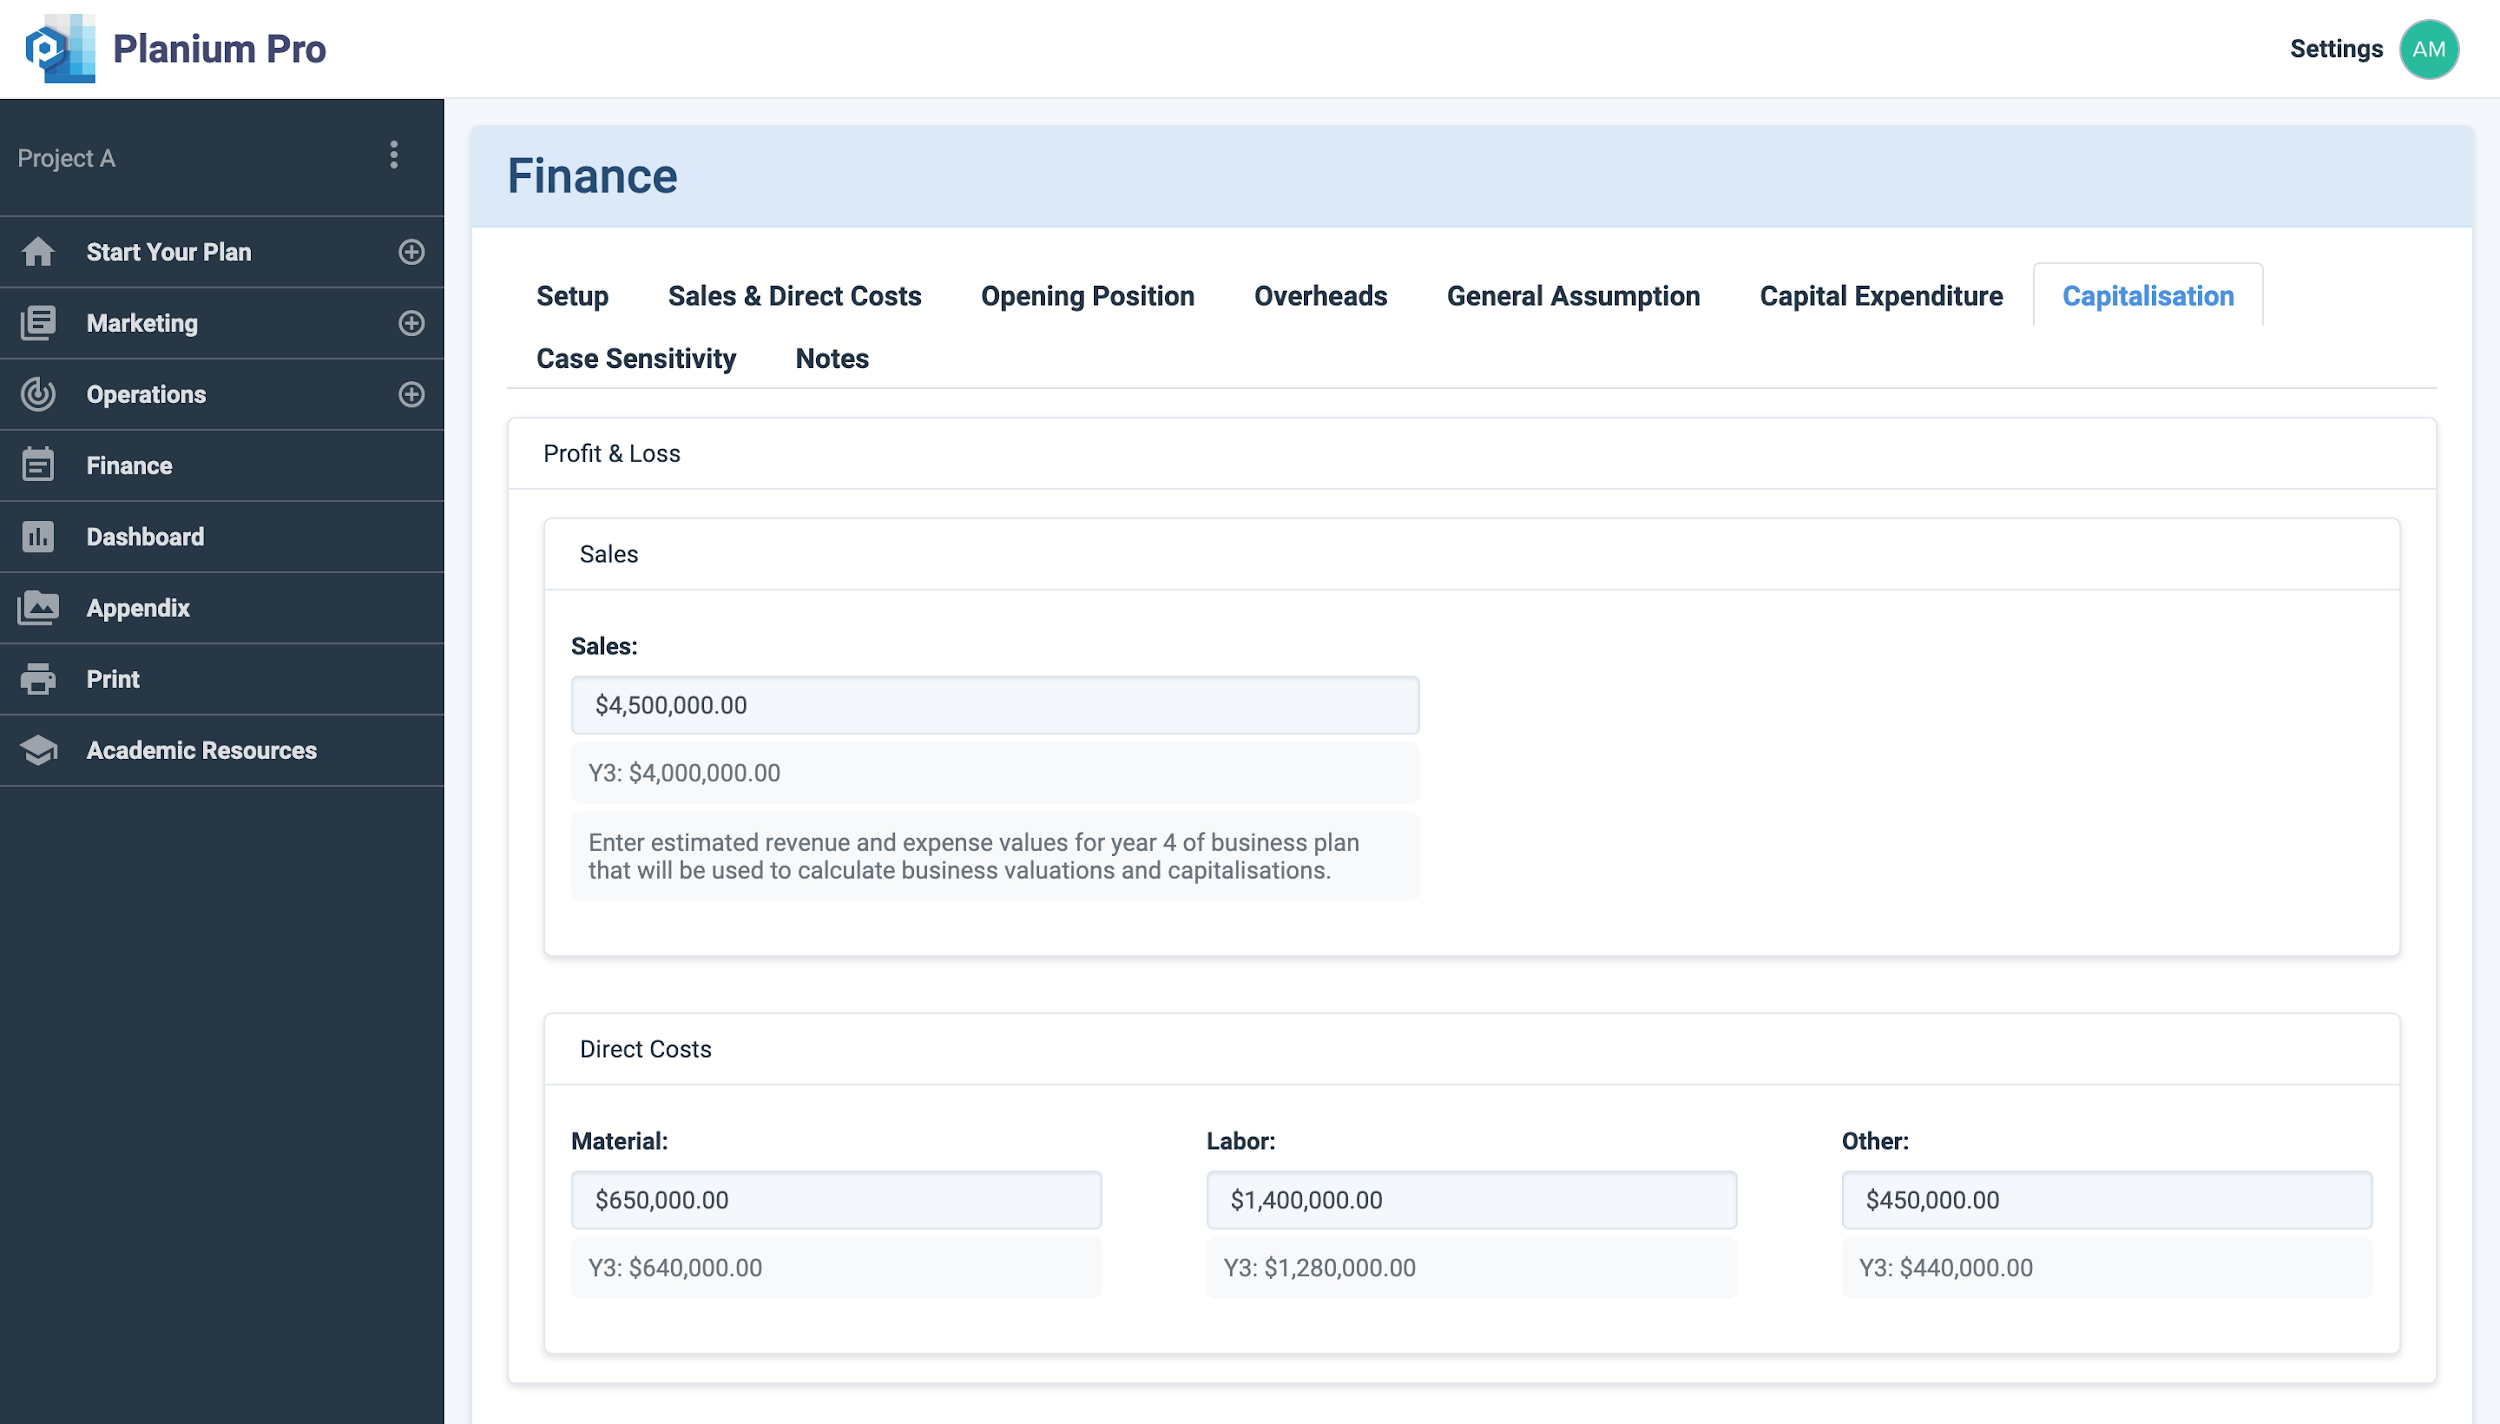
To complete this section, in the menu across the top of your screen, select ‘Capitalisation’. For this section, enter the estimated revenue and expense values for Year 4 of the business plan that will be used to calculate business valuations and capitalisations.
Profit & Loss
- Sales: Enter the total sales revenue for year 4.
- Direct costs:
- Material: Enter the direct material cost for year 4.
- Labor: Enter the direct labour cost for year 4.
- Other: Enter the direct other selling cost for year 4.
- Overheads:
- Admin: Enter the cost of all employees, contractors or other personnel for year 4.
- Rent & Equipment: Enter the cost of rent and lease expenses for year 4.
- Maintenance: Enter the cost of maintenance and utility expenses for year 4.
- Marketing: Enter the cost of marketing expenses for year 4.
- R&D/Other: Enter the cost of R&D and other expenses for year 4.
- Valuation / Capitalisation Method:
- EBIT: Enter both low and high expectation EBIT multiples related with the type of business or industry to provide an indication of enterprise value to external stakeholders.
- EBITDA: Enter both low and high expectation EBITDA multiples related with the type of business or industry to provide an indication of enterprise value to external stakeholders.
- NPAT x PE Ratio: Enter both low and high expectation NPAT/PE multiples related with the type of business of industry to provide an indication of equity value to external stakeholders.
Click ‘Update’ to save changes.
Strategic decision making involves analysis of the past, current situations and expected future. In the past organizations have usually only considered the expected future based on straight-line graph of current trends, which ignored changes in demographic, economic and environmental conditions. However, many companies are using scenario planning to analyze strategic options. Scenario planning is defined as a strategic planning method organization used to make flexible long-term plans and starts by using the knowledge about what is known and considering the elements that are uncertain or unknown. Given that the economic, political, social and environmental environment is uncertain—Scenario analysis helps decision-makers to anticipate hidden weaknesses and inflexibilities in organizations and methods. These weaknesses can be avoided, or their impacts minimized more effectively than simply reacting to real-life problems once they occur.
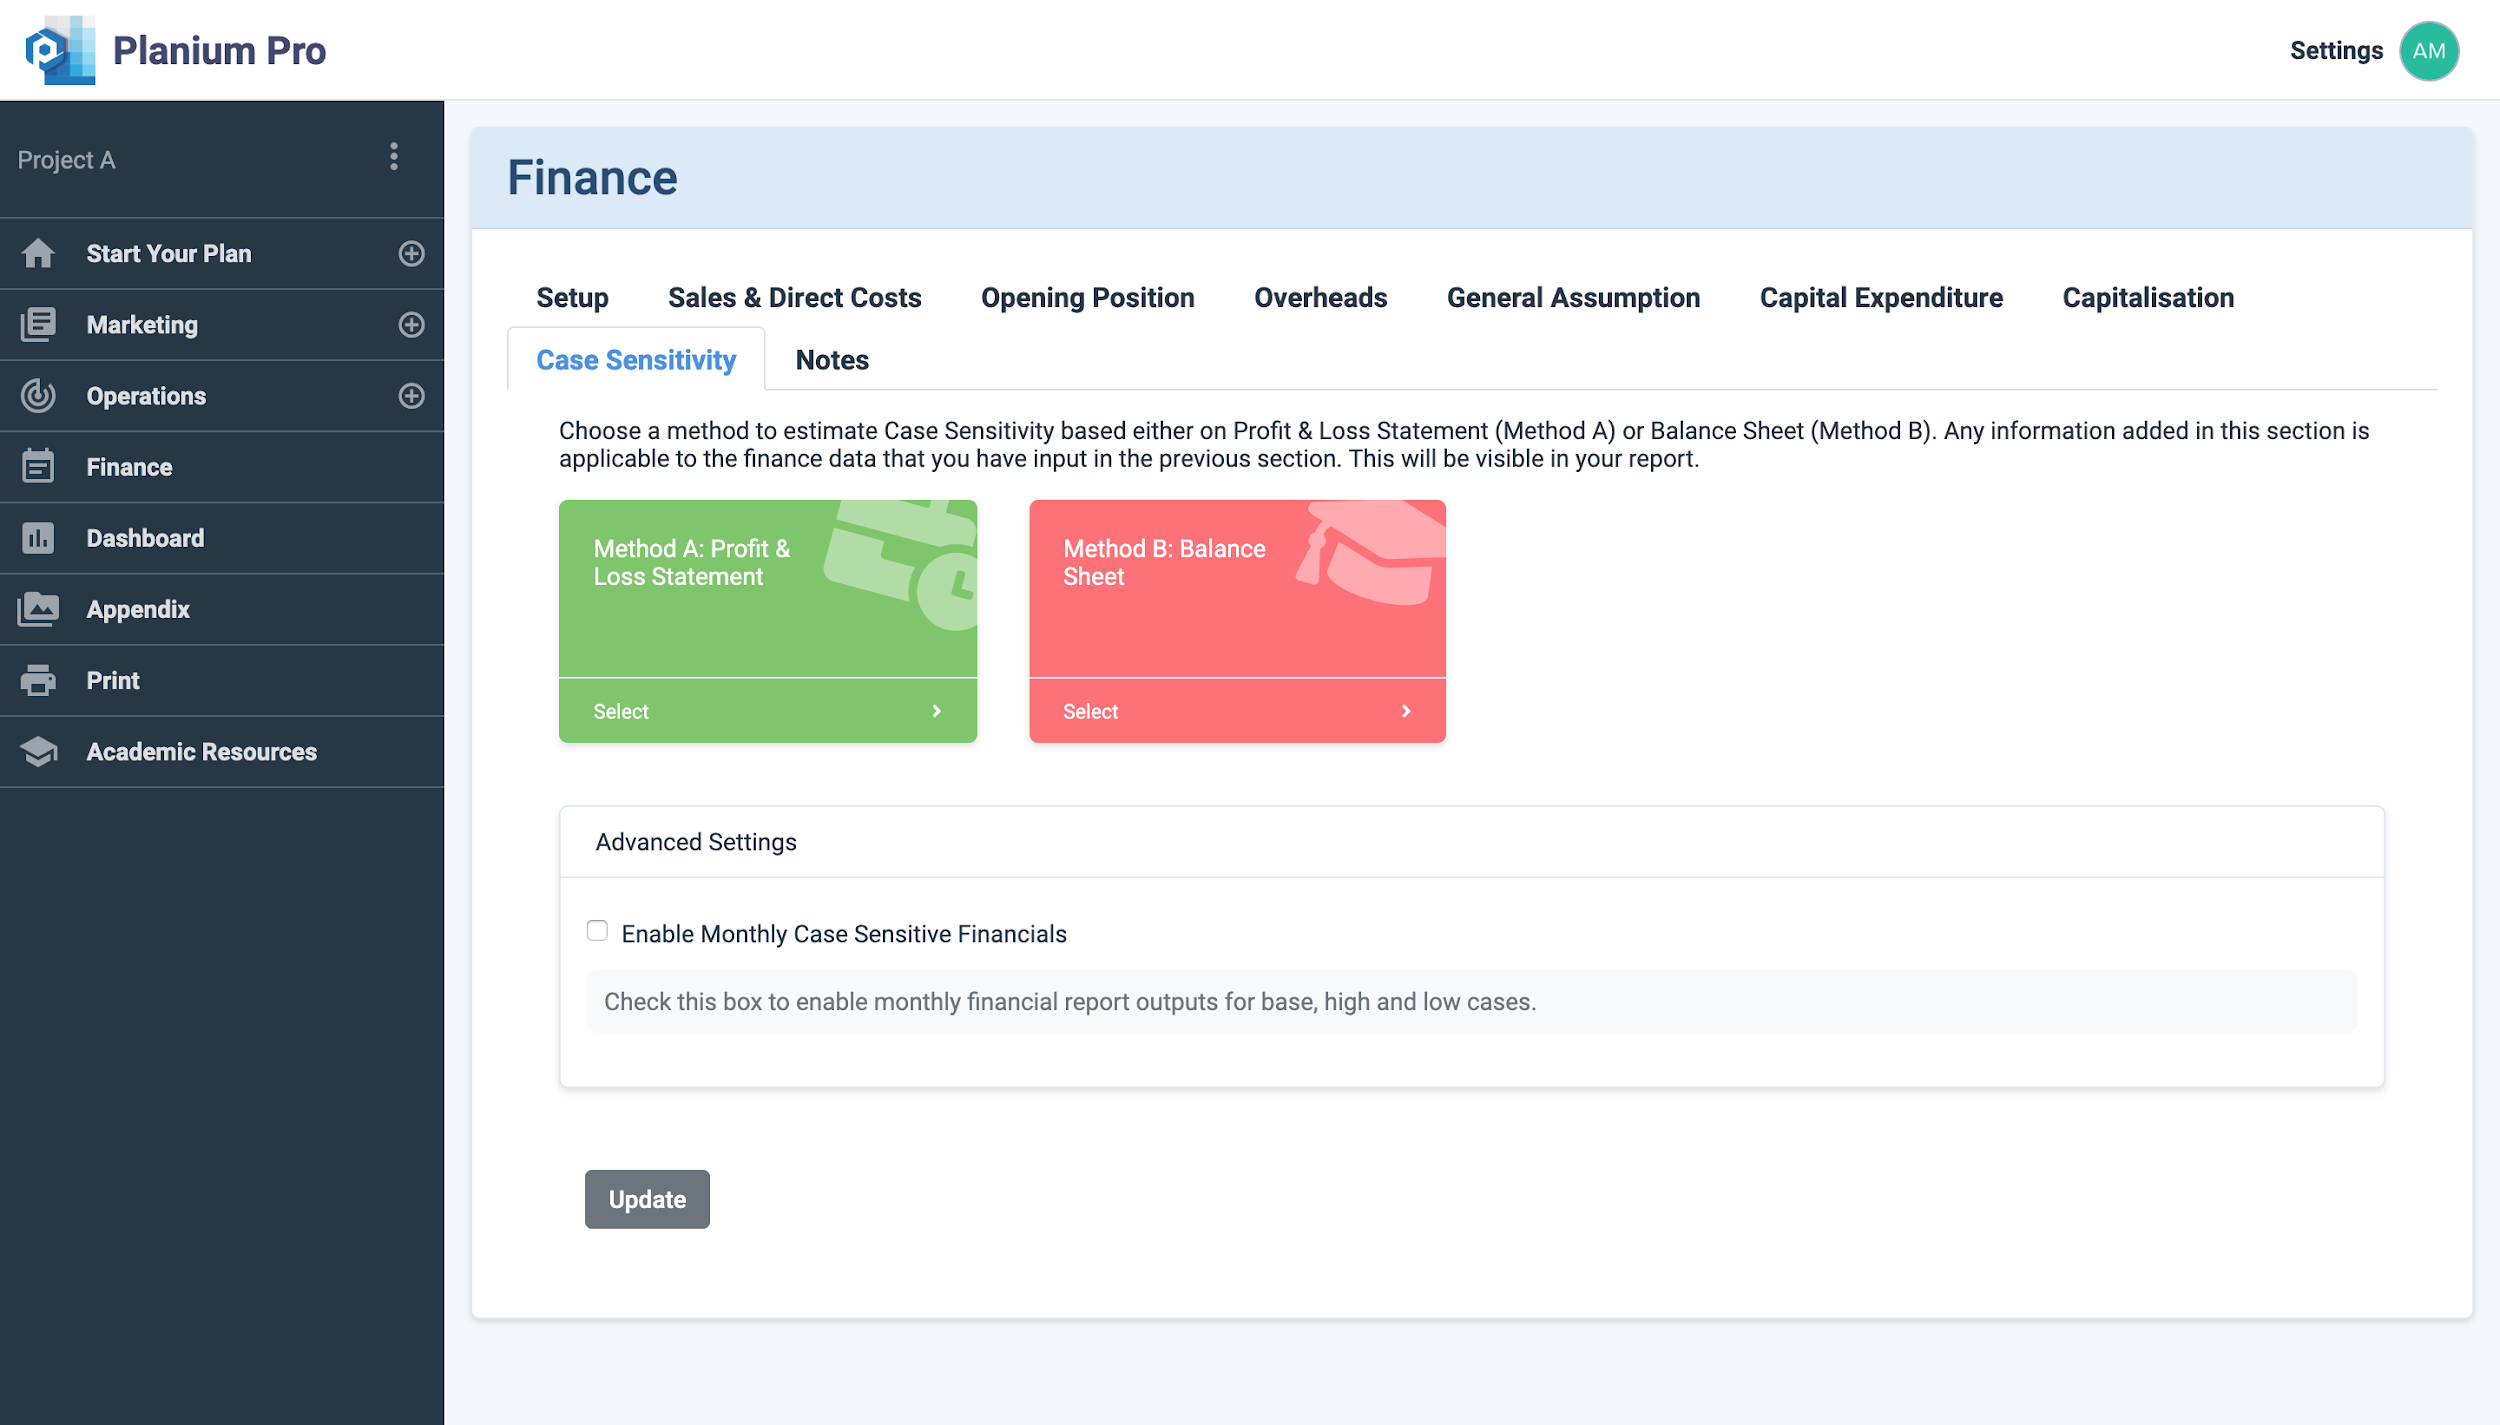
Planium Pro offers two methods to estimate Case Sensitivity based either on Profit & Loss Statement (Method A) or Balance Sheet (Method B).
To complete this section, in the menu across the top of your screen, select ‘Case Sensitivity’.
Select which method you prefer to use to conduct a case sensitivity analysis. The following sections explain each method in further detail.
Method A
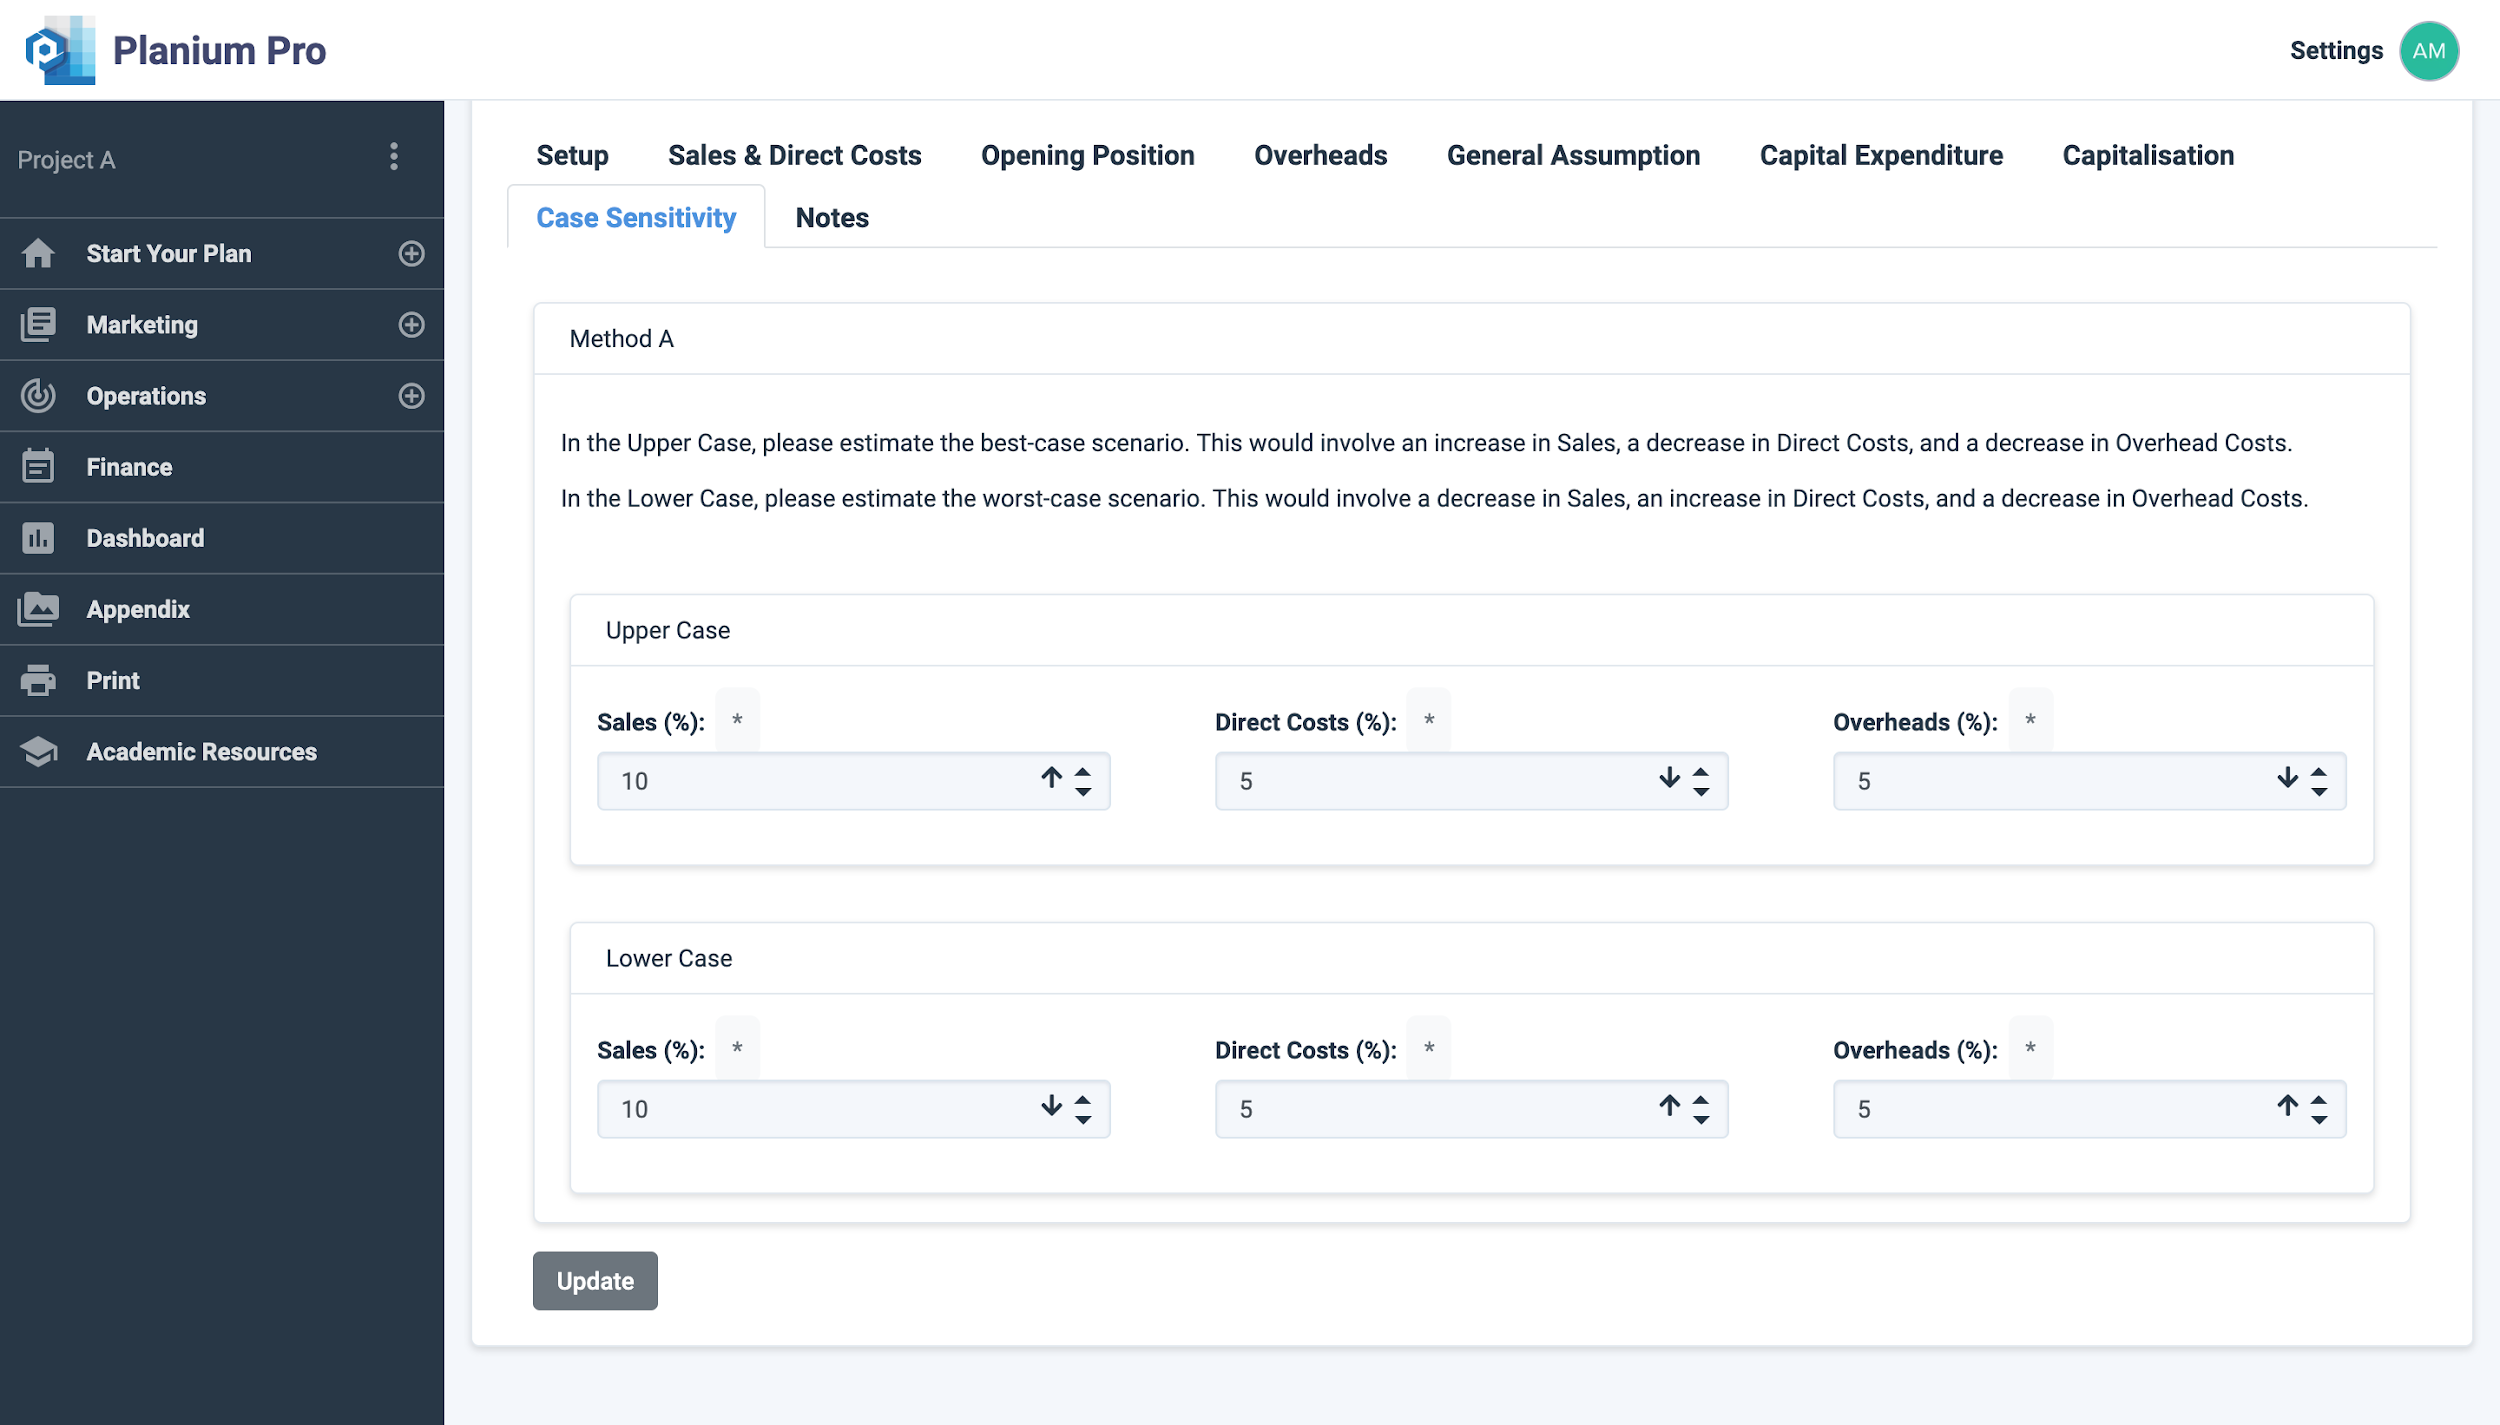
Upper Case:
In Upper Case, choose the best-case scenario where Sales percentage would increase, and Direct Costs and Overhead would decrease.
- Sales % ↑
- Direct Costs %↓
- Overheads %↓
Lower Case
In Lower Case, choose the worst-case scenario where Sales percentage would decrease, and Direct Costs and Overhead would increase.
- Sales % ↓
- Direct Costs %↑
- Overheads %↑
Click ‘Update’ to save changes.
Method B
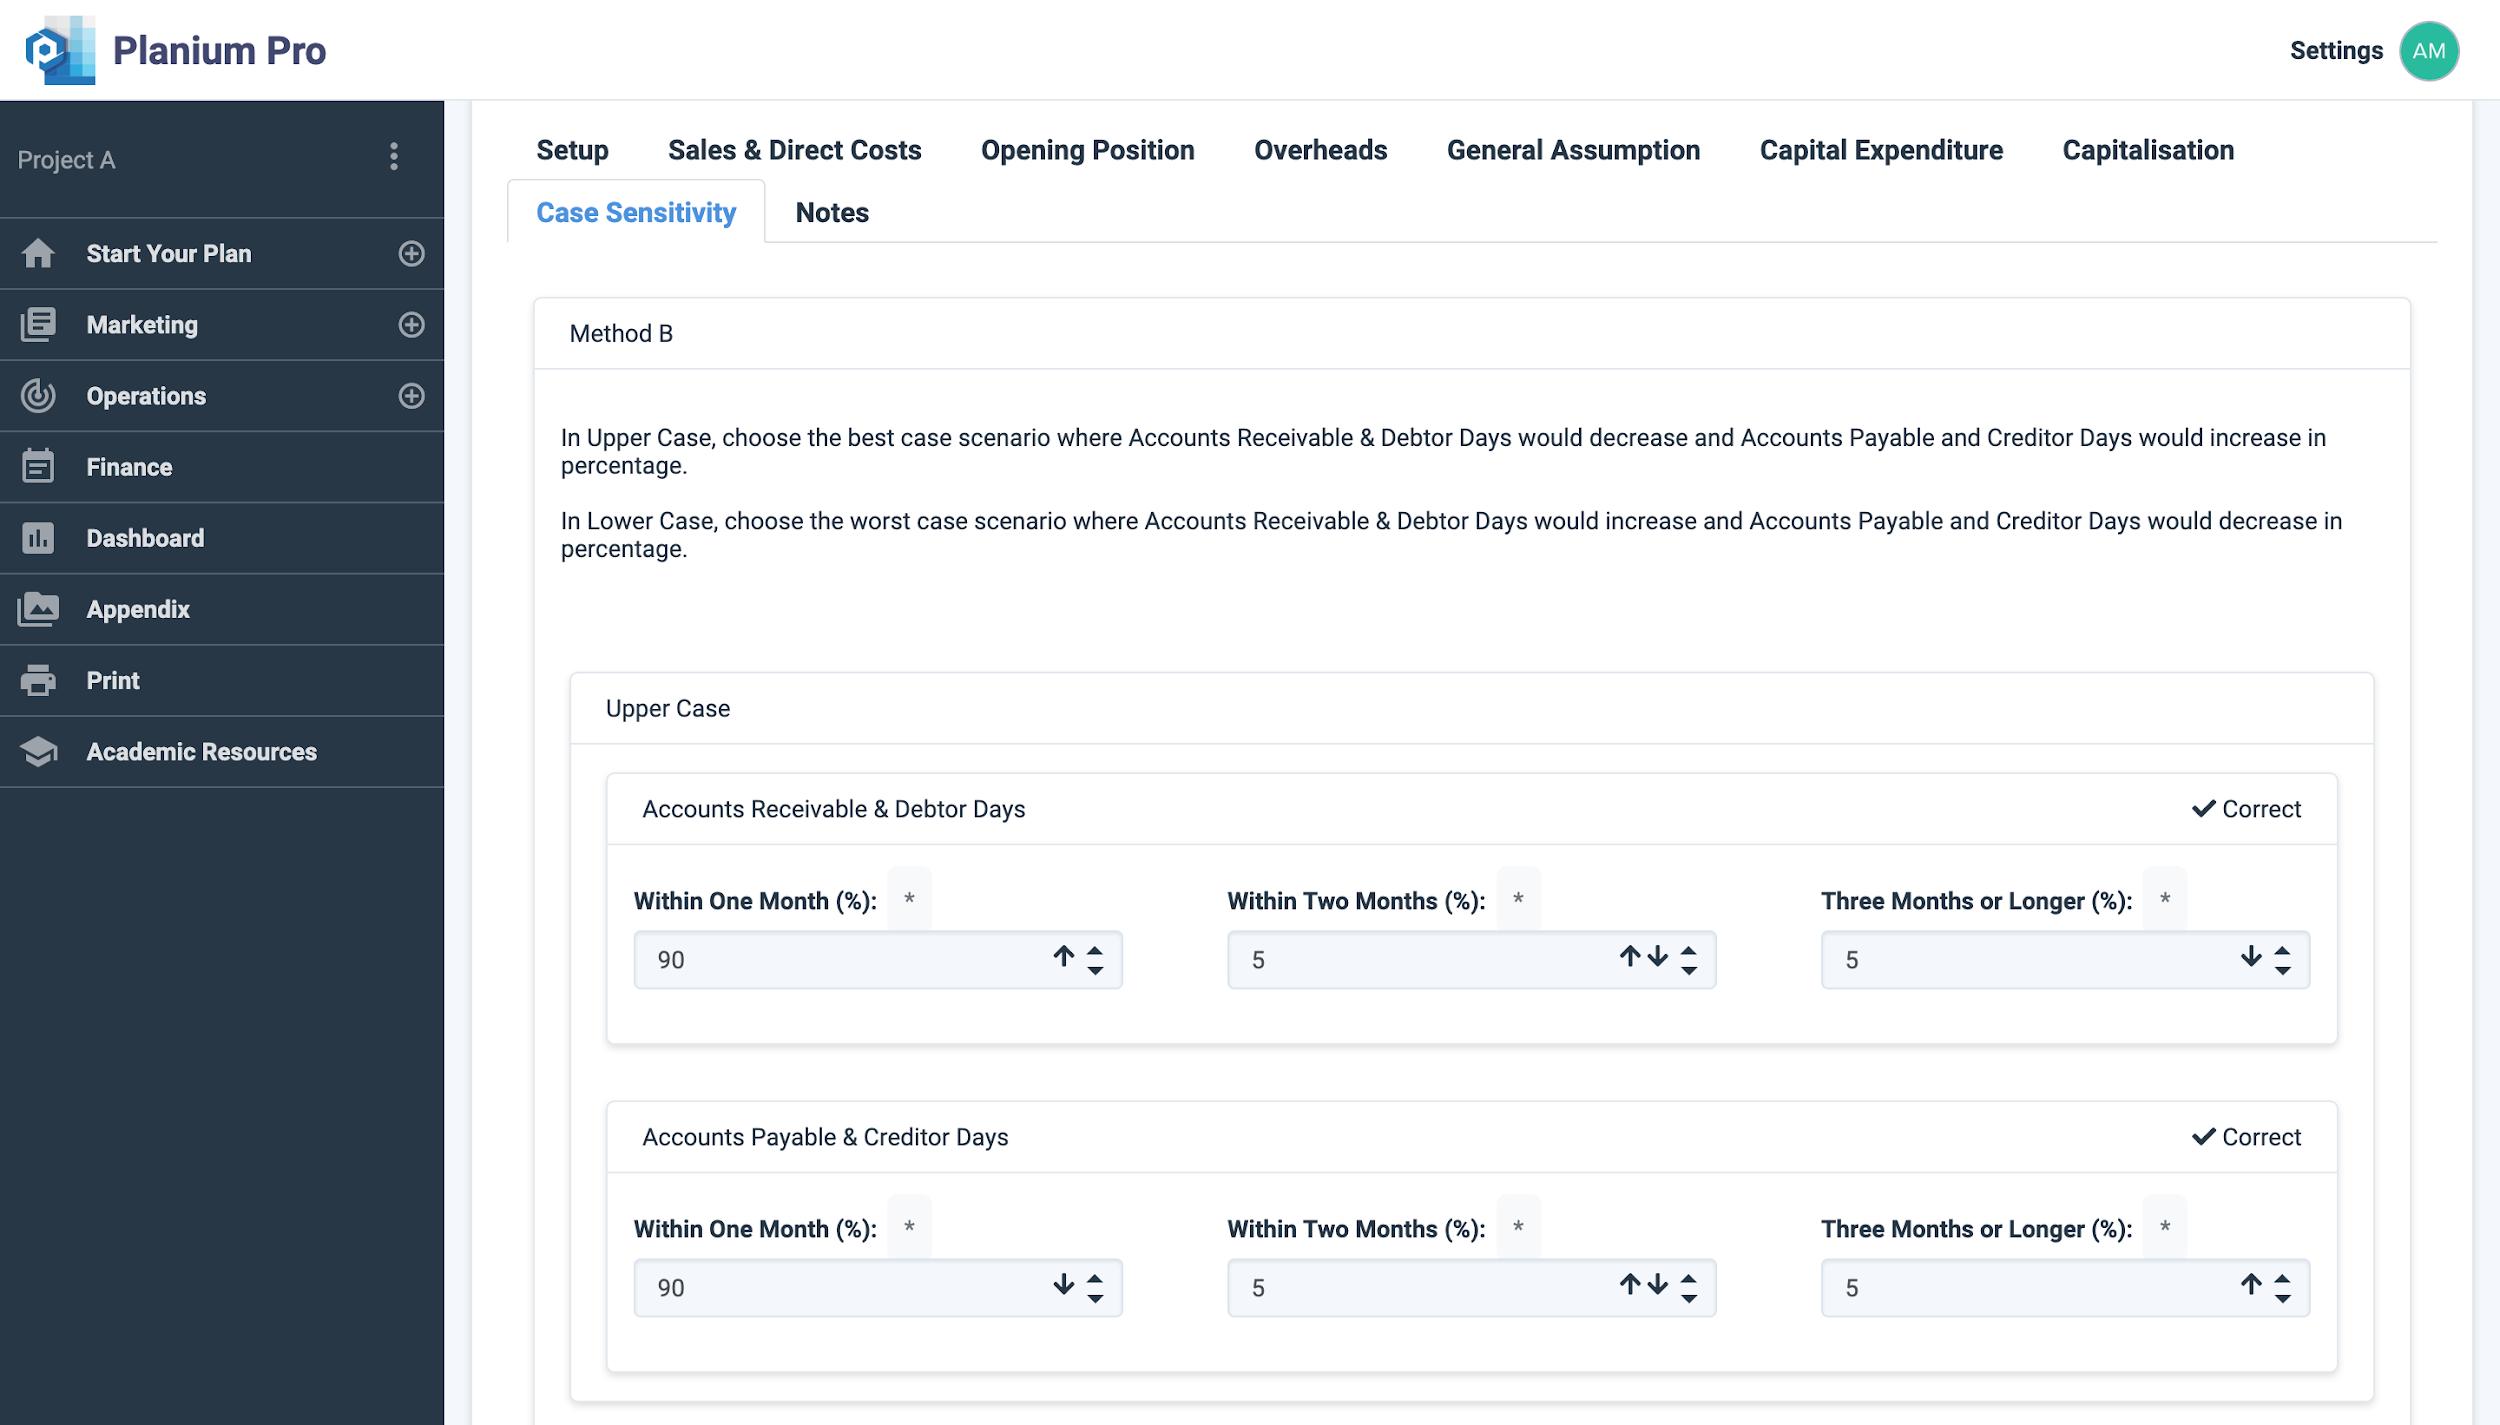
Upper Case
In Upper Case, choose the best-case scenario where Accounts Receivable & Debtor Days would decrease and Accounts Payable and Creditor Days would increase in percentage.
Accounts Receivable & Debtor Days
- Within One Month %↑
- Within Two Months %↑↓
- Three Months or Longer %↓
Accounts Payable & Creditor Days
- Within One Month %↓
- Within Two Months %↑↓
- Three Months or Longer %↑
Lower Case
In Lower Case, choose the worst-case scenario where Accounts Receivable & Debtor Days would increase and Accounts Payable and Creditor Days would decrease in percentage.
Accounts Receivable & Debtor Days
- Within One Month %↓
- Within Two Months %↑↓
- Three Months or Longer %↑
Accounts Payable & Creditor Days
- Within One Month %↑
- Within Two Months %↑↓
- Three Months or Longer %↓
Click ‘Update’ to save changes.
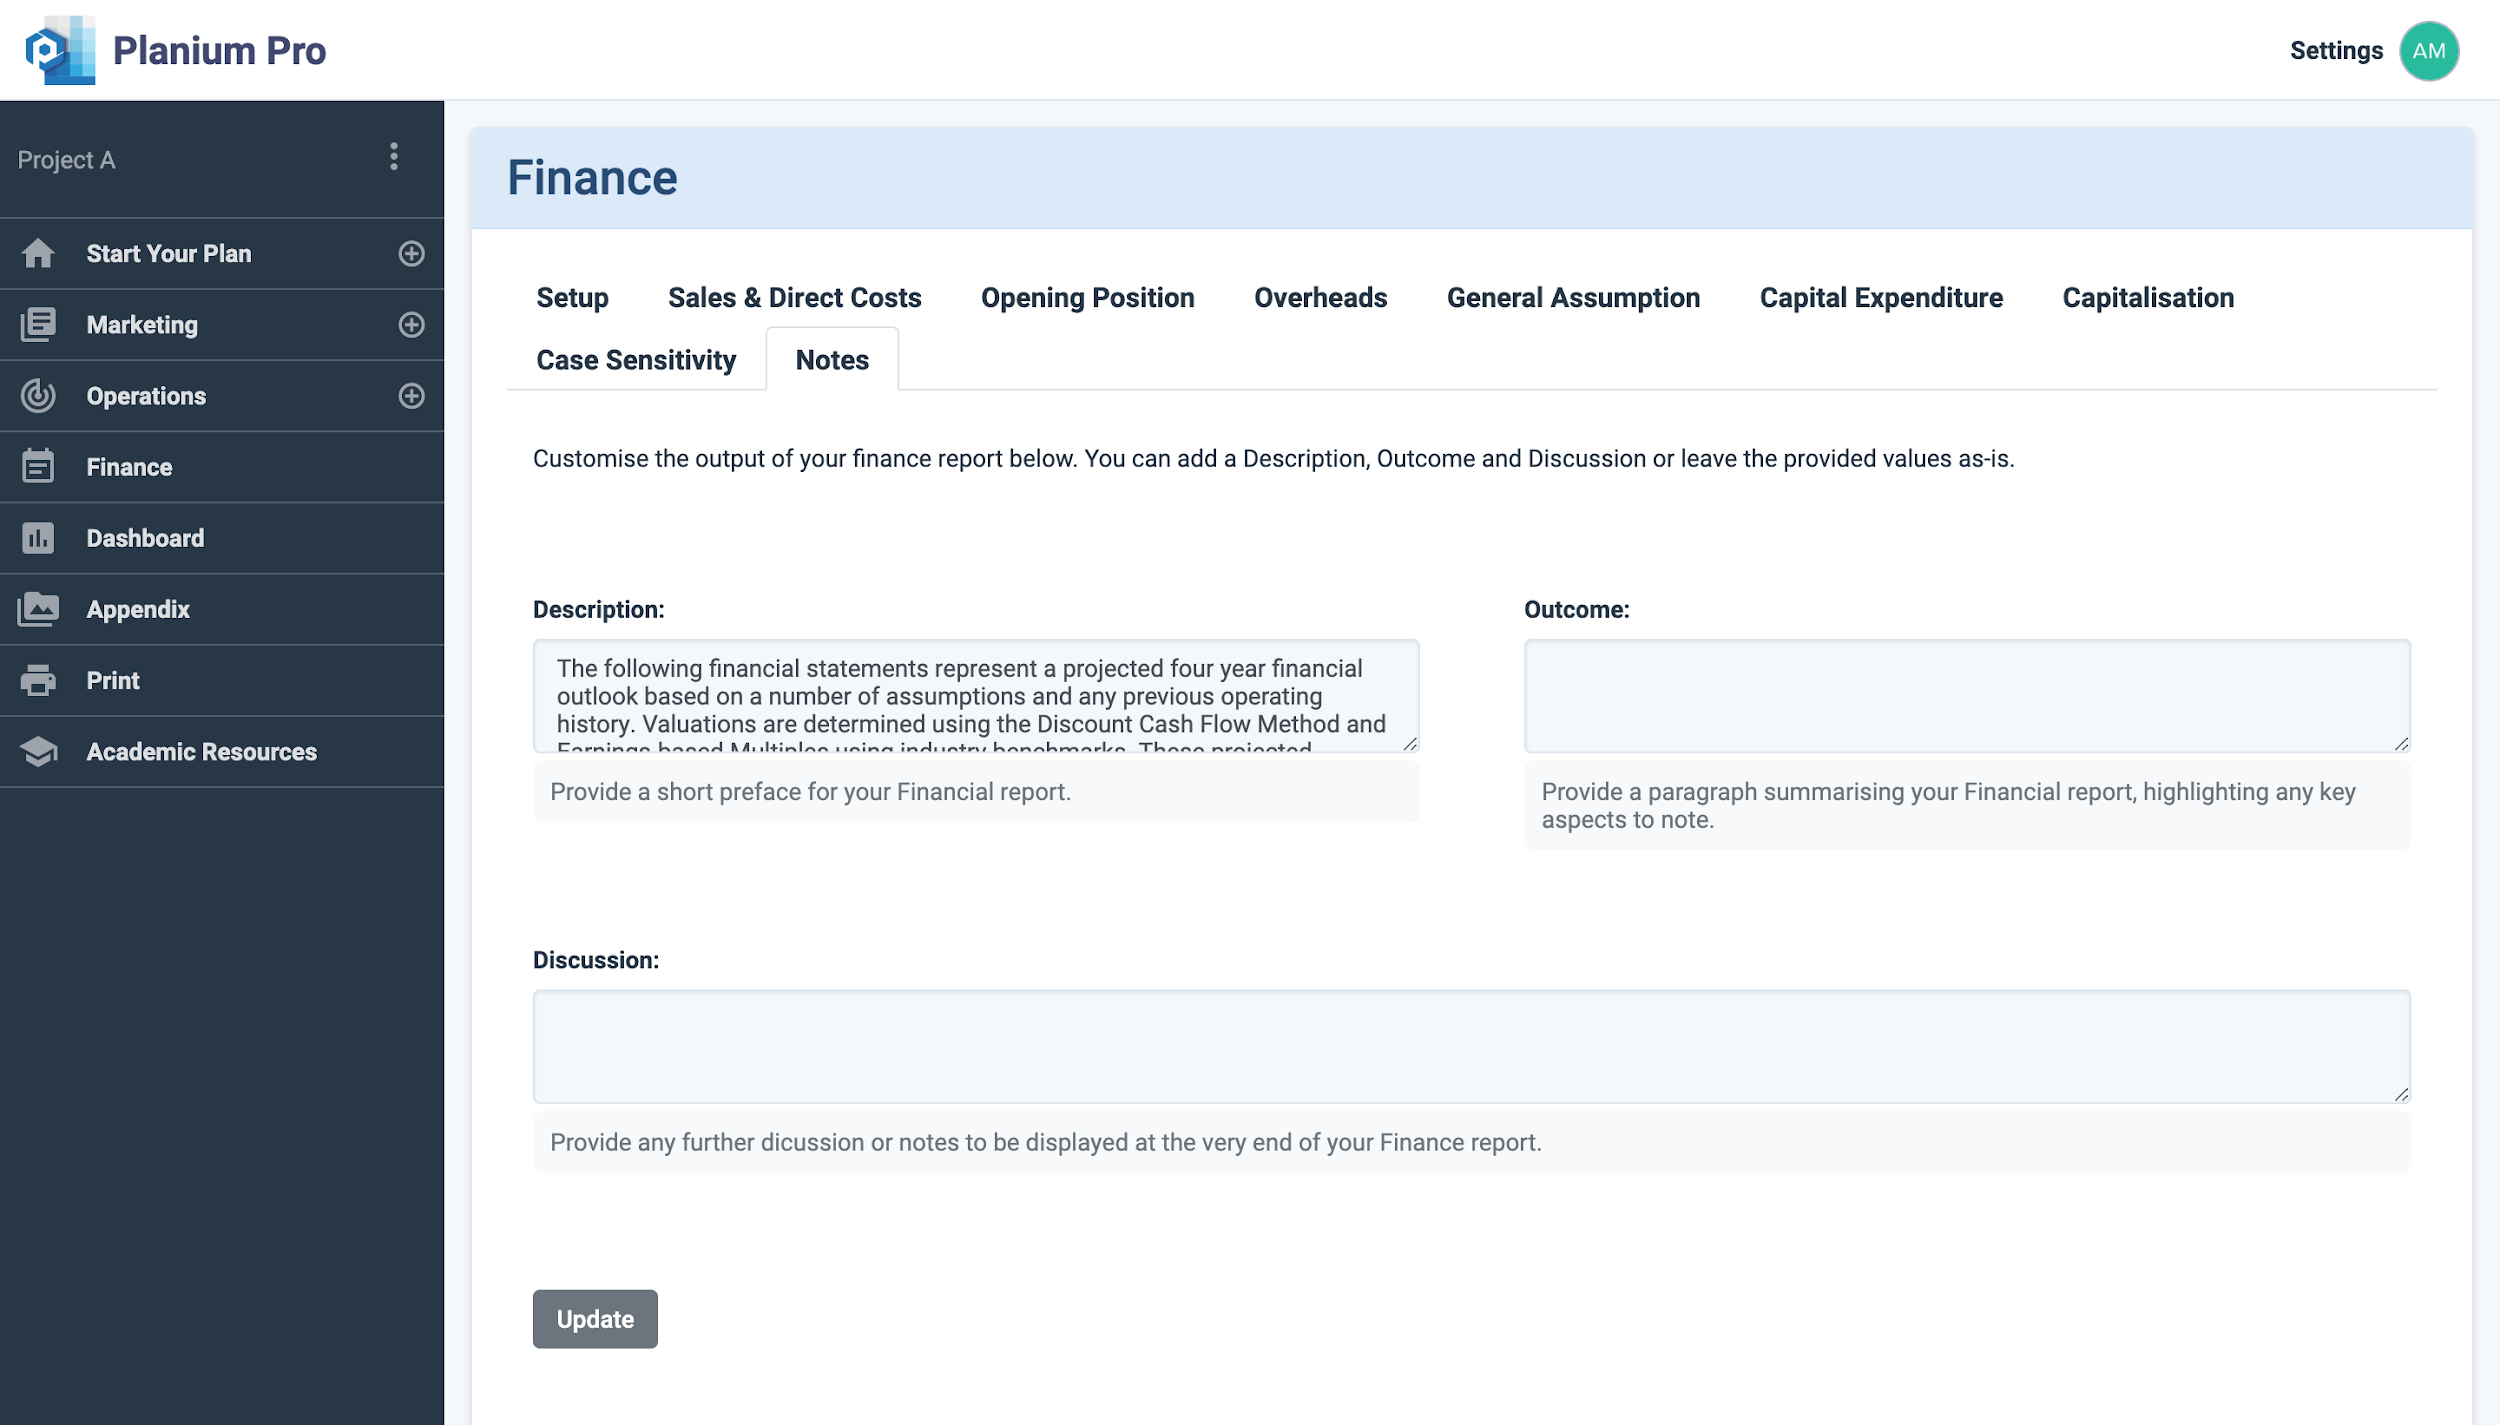
To complete this section, in the menu across the top of your screen, select ‘Notes’.
Notes: Customise the output of your finance report below. You can add a Description, Outcome and Discussion or leave the provided values as-is.
Description: Provide a short preface for your Financial report.
Outcome: Provide a paragraph summarising your Financial report, highlighting any key aspects to note.
Discussion: Provide any further discussion or notes to be displayed at the very end of your Finance report.
Click ‘Update’ to save changes.