Lite Knowledge Base

1.Getting Started
Welcome to Planium Pro Lite – a version that has been specifically designed for Individuals. If you are just getting started, this article will teach you the basics of Planium Pro Lite and how to use key features. Choose or navigate to a section to get started on a particular topic.
Below is the main Planium Pro Lite interface. After creating a project, start here to navigate to each section of your business plan.
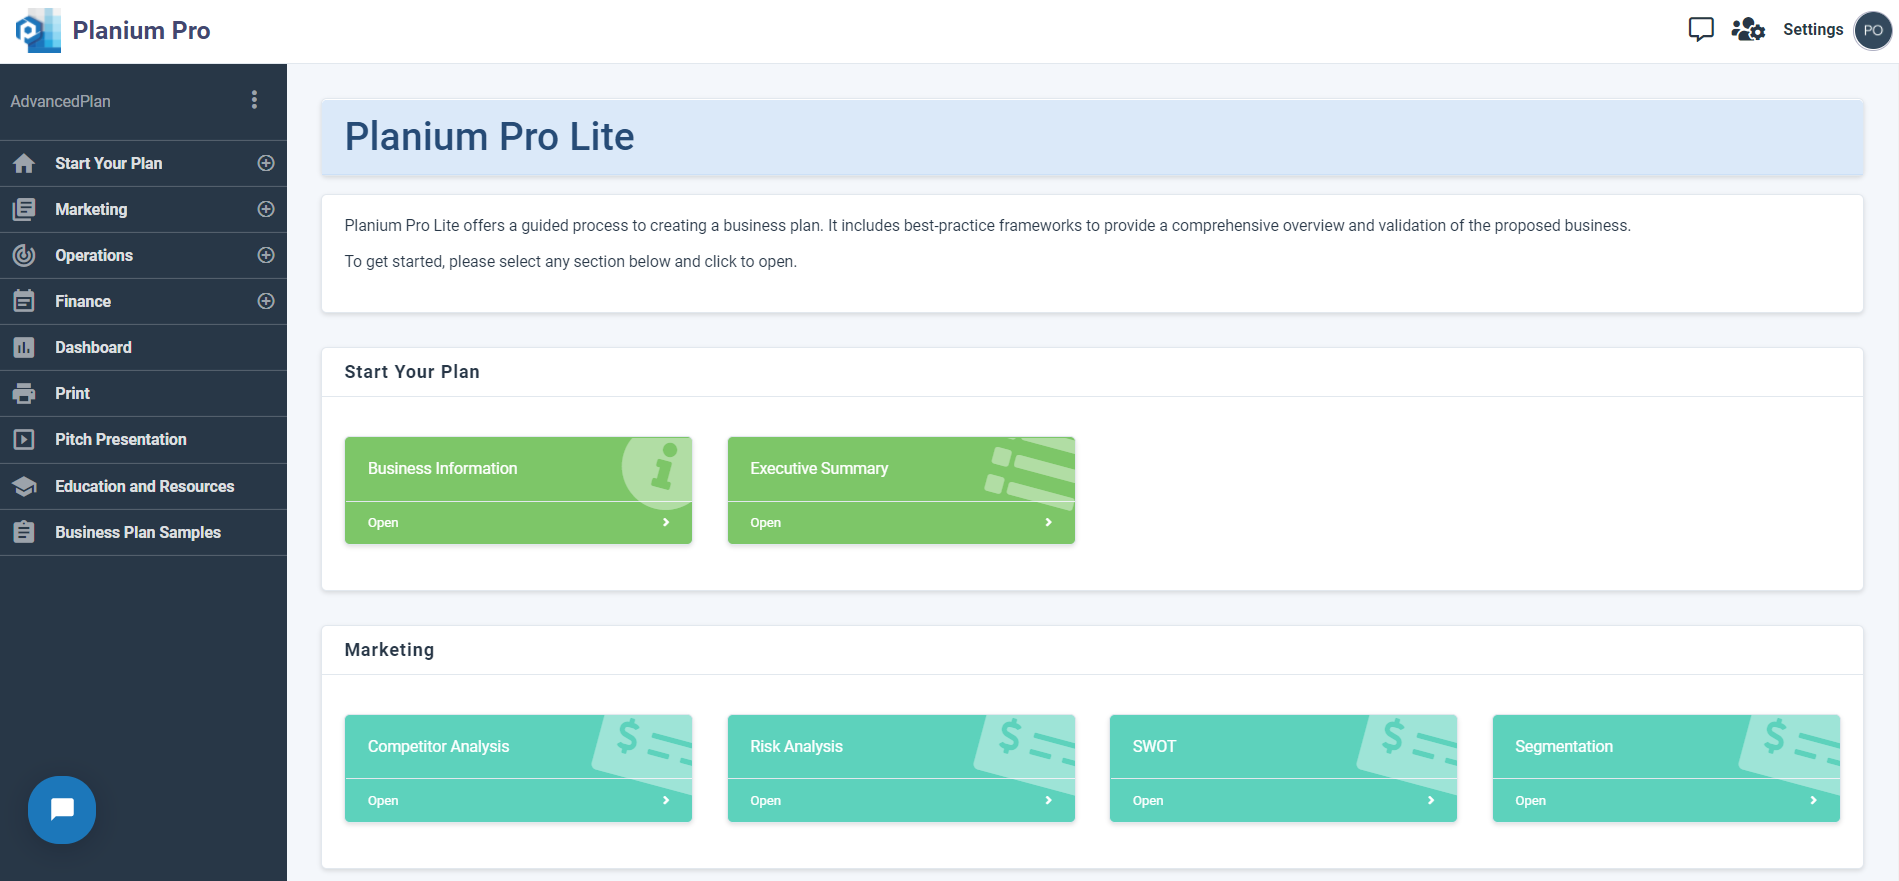
2.Marketing
This section clearly defines and describes the business’ target market and competitors. Frameworks to assist with this analysis include Competitor Analysis, Risk Analysis, SWOT and Segmentation.
2.1.Competitor Analysis
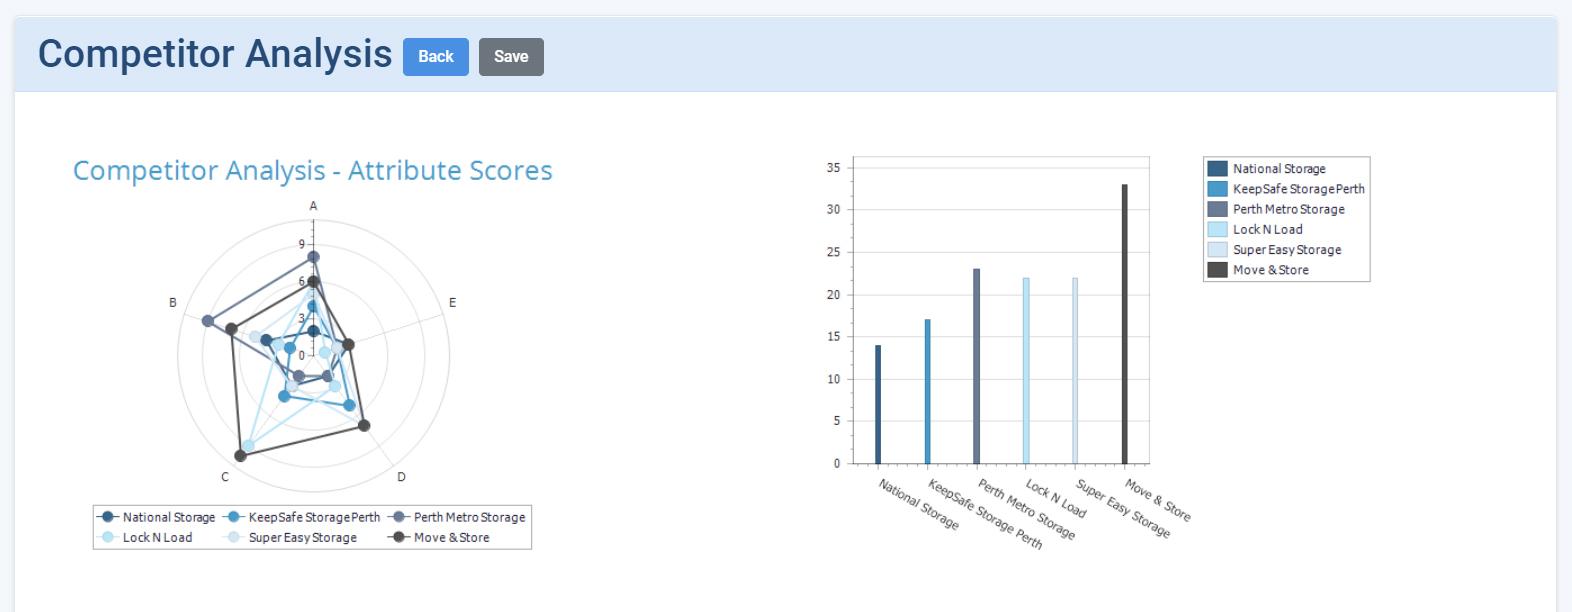
Competitor Analysis is an evaluation of the strengths and weaknesses of the competition. They are ranked on aspects such as pricing, quality and service to assess where they fall in comparison to the proposed business, and other competitors. This process will also help to determine the business’ competitive advantage.
Using Competitor Analysis on Planium Pro Lite
To complete section, on the left-hand side menu bar, click the + to expand the ‘Marketing’ menu and select ‘Competitor Analysis’.
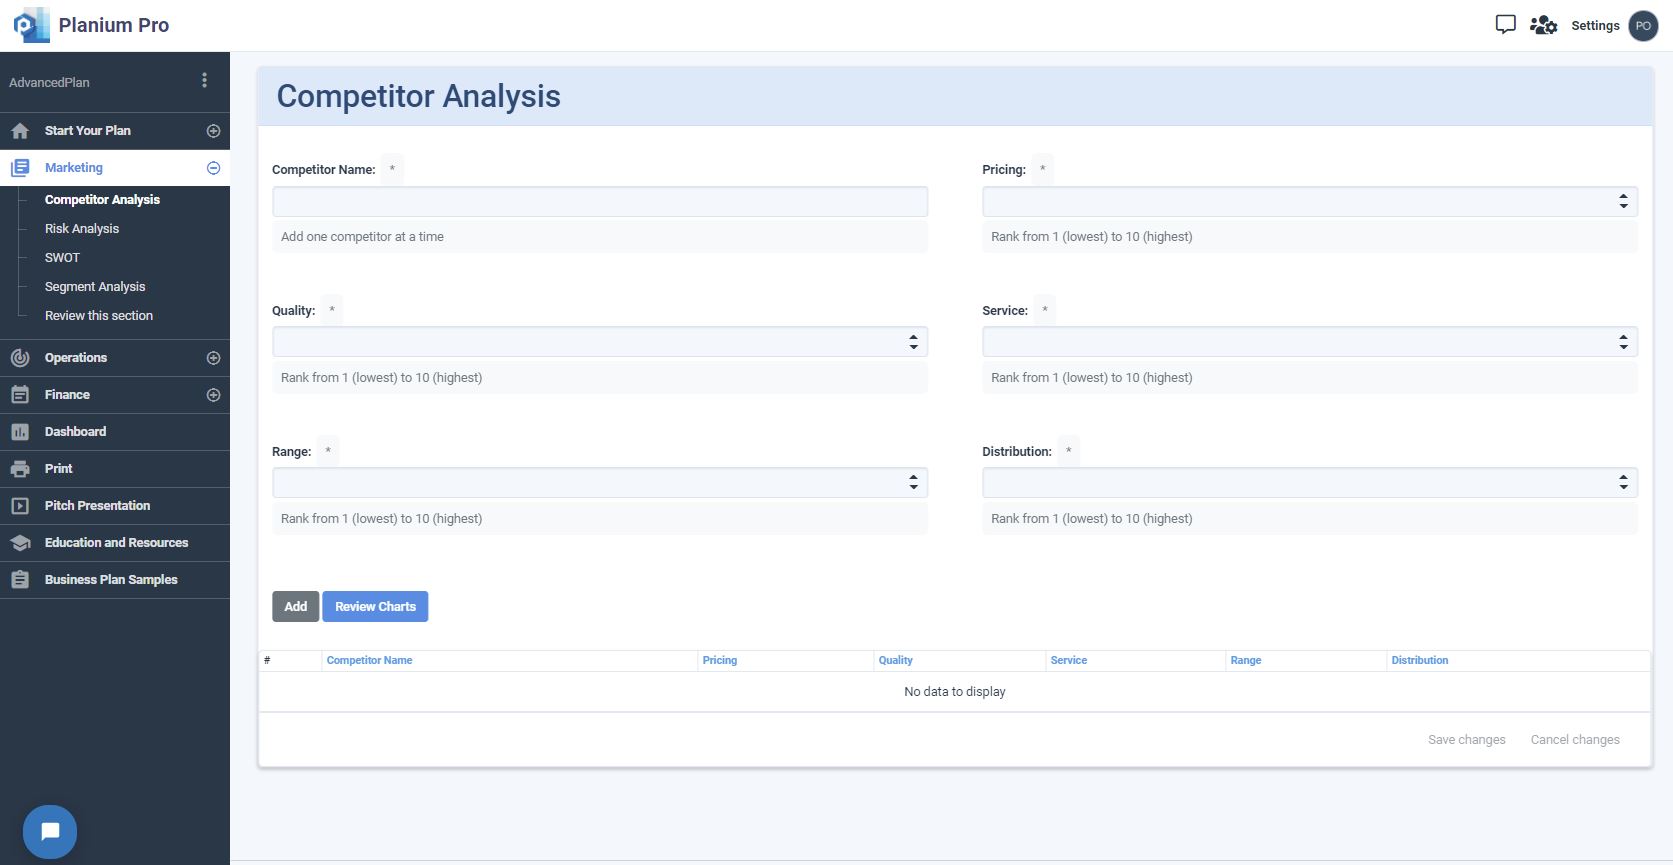
Add one competitor at a time, and allocate a number on the following fields:
- Pricing: Rank the competitor’s pricing from 1 (being the lowest) to 10 (being the highest)
- Quality: Rank the competitor’s quality from 1 (lowest) to 10 (highest)
- Service: Rank the competitor’s service from 1 (lowest) to 10 (highest)
- Range: Rank the competitor’s range from 1 (smallest) to 10 (largest)
- Distribution: Rank the competitor’s distribution from 1 (smallest) to 10 (largest)
Click ‘Add’ to save changes.
Click ‘Chart Preview’ to view the analysis results.
Analysing Competitor Analysis Results on Planium Pro Lite
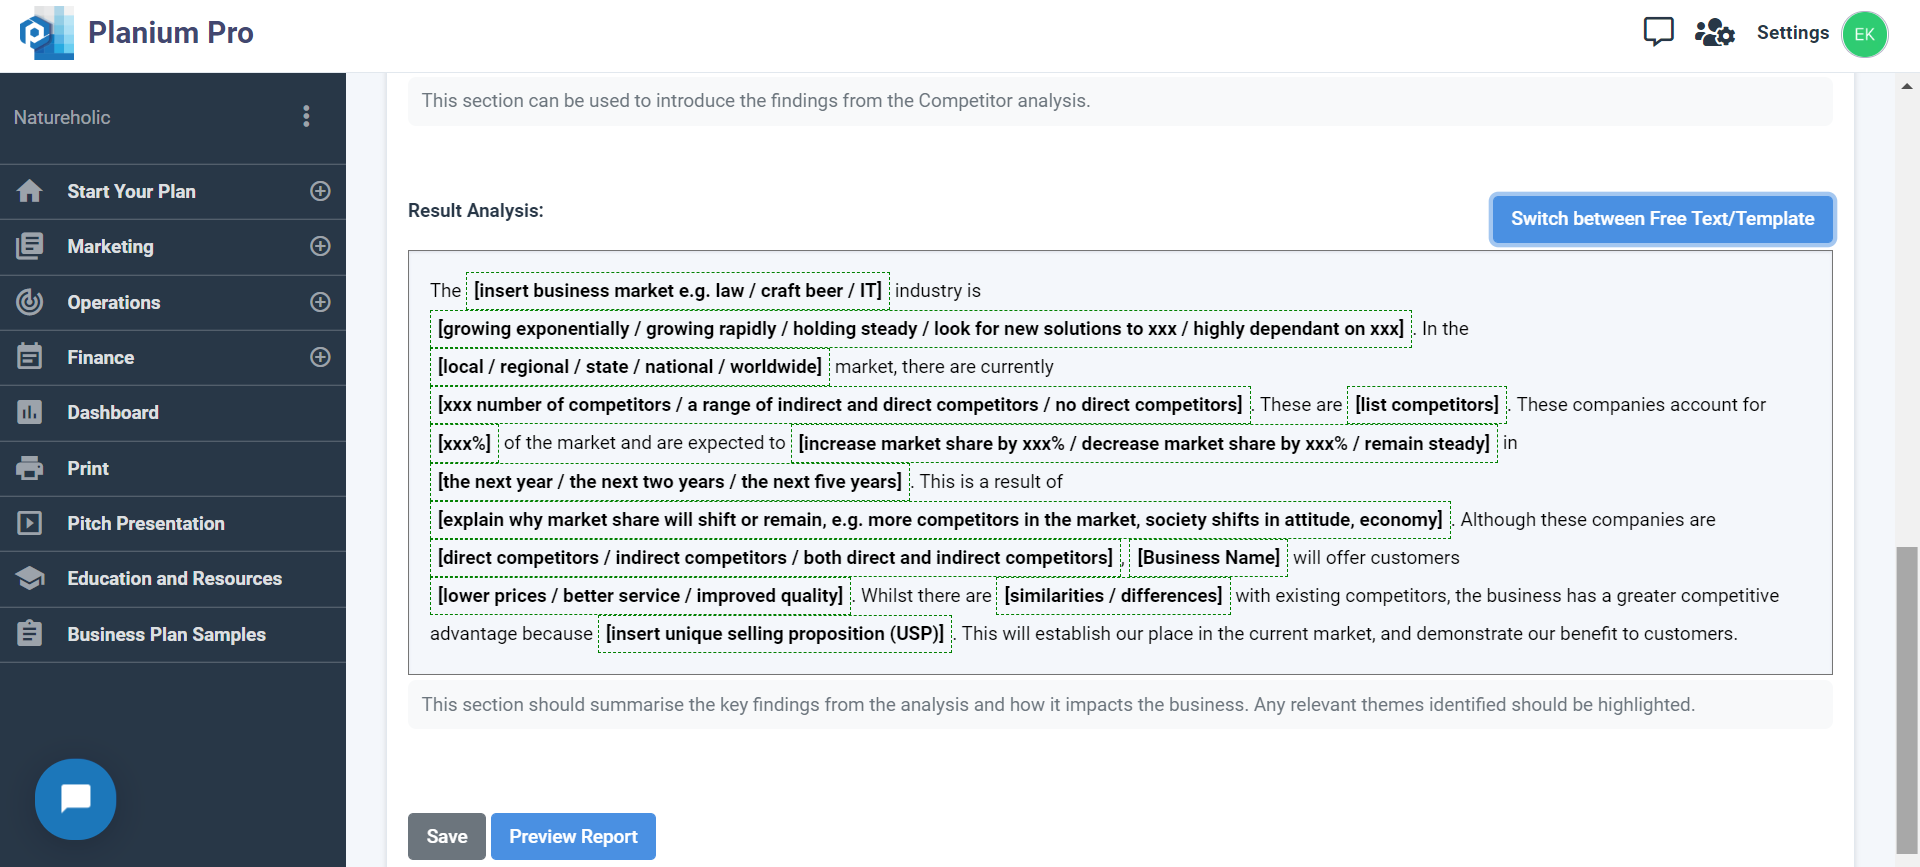
Under ‘Competitor Analysis Introduction’, you have an option to leave a pre-written text and use the suggested template or press ‘Switch between Free Text/Template’ to input any introductory information that may benefit your client or investor.
‘Analysis Results’ is the section to write-up the analysis on the graph and describe any key themes that are present in the data. Press ‘Switch between Free Text/Template’ to use the template.
Click ‘Save’ to save changes.
Click ‘Report Preview’ to view the write-up in report format.
2.2.Risk Analysis
Managing risk is important for all businesses, no matter the size. There are different types of risk with different degrees that can impact the organisation’s performance. Risk analysis is the process of identification, response planning, mitigation and management. The objectives of risk mitigation are to increase the likelihood and impact of positive events and decrease the likelihood and impact of negative events in the project.
Using Risk Analysis on Planium Pro Lite
To complete this section, on the left-hand side menu bar, click the + to expand the ‘Marketing’ menu and select ‘Risk Analysis’. Use the explanations below to complete the information in the corresponding fields.
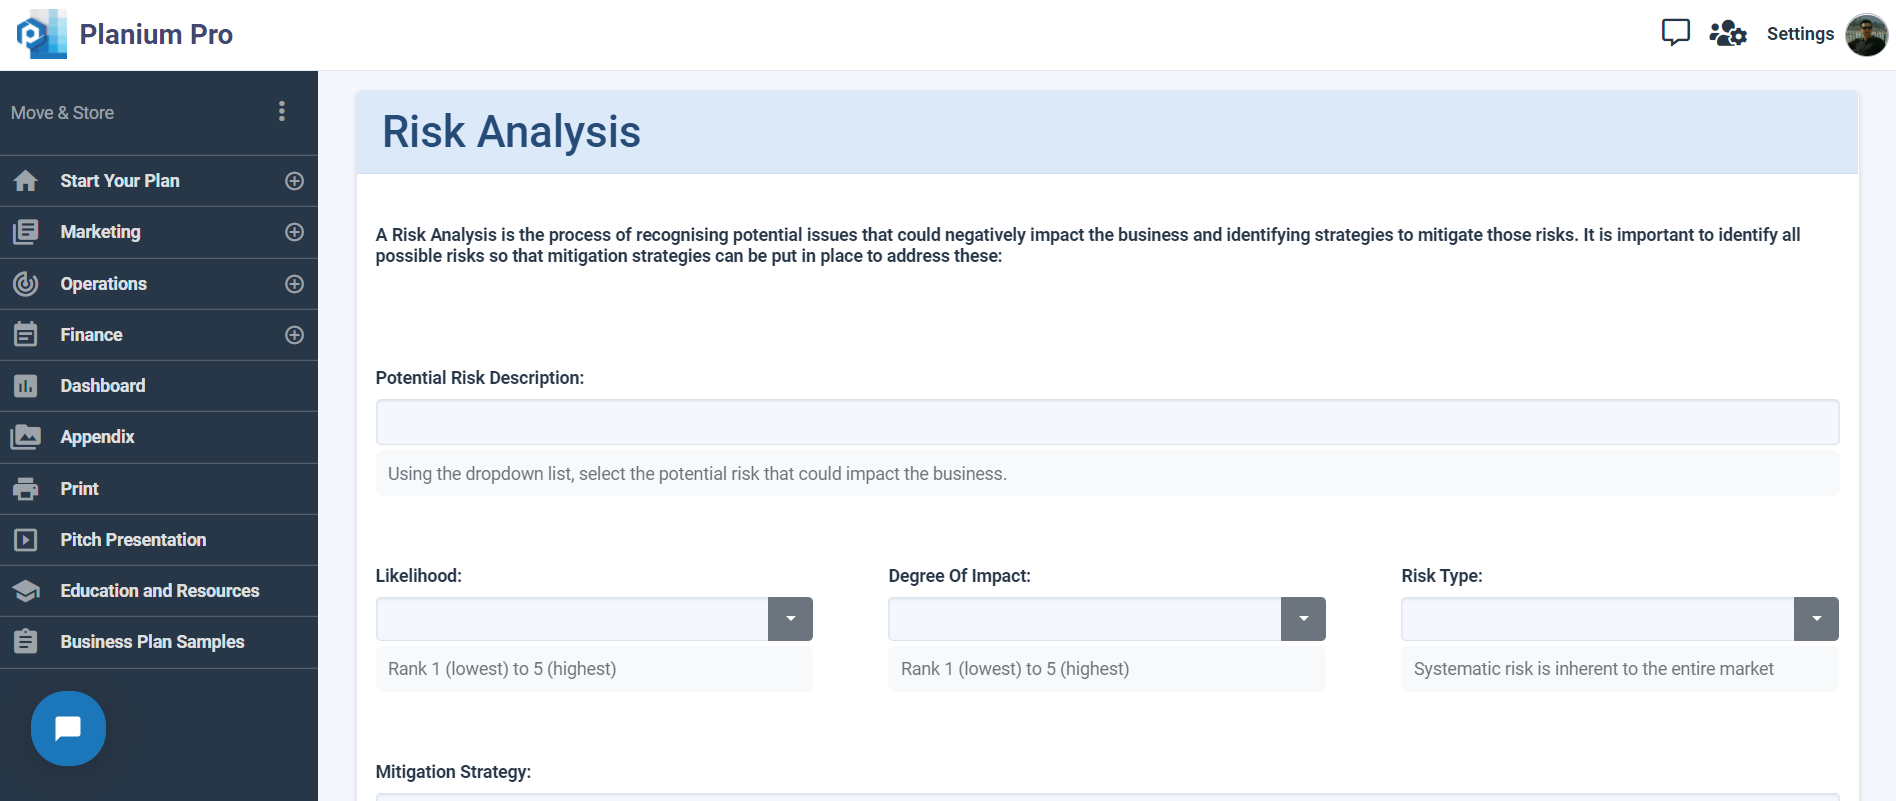
Potential Risk Description:
A dropdown menu will appear when this field is clicked. Below are the types of risks. Select one relevant risk at a time to assess.
| Governance & Ethics | Competition | Innovation |
| Intellectual Property | Business | Economy |
| Technology | Project | Sustainability |
| Reputation | Interest Rate | Currency |
| Credit | Capital | Inflation |
| Market | Liquidity | Concentration |
| Fraud | Sovereign | Operational |
| Logistics | Liability | Workplace |
| Culture | Compliance | Other |
Likelihood:
Rank the likelihood the risk will occur from 1 (lowest possible chance of occuring) to 5 (highest possible chance of occuring).
Degree of Impact:
Rank the degree of impact the risk holds from 1 (lowest possible impact) to 5 (highest possible impact).
Type of Risk:
- Systematic (non-diversifiable) risk concerns factors that affect the whole market and generally cannot be avoided. These are on the national and international scale, such as inflation, changes to international relations, or war.
- Non-systematic (diversifiable) risk relates to factors that affect one or a small number of firms, such as a workers’ strike, legal proceedings, or change of management. This can generally be mitigated by diversifying.
Mitigation Strategy:
State how the business or project will overcome or avoid the given risk.
Click ‘Add’ to save changes.
Click ‘Chart Preview’ to view the analysis results.
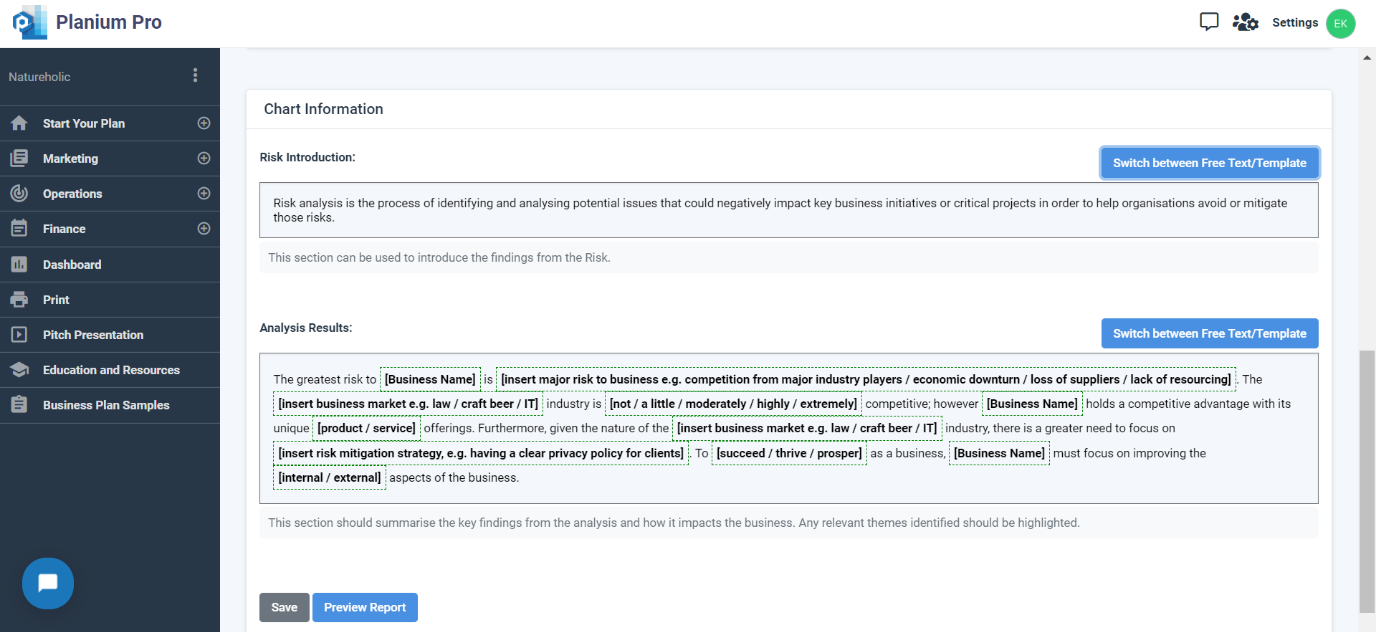
Analysing Risk Analysis Results on Planium Pro Lite
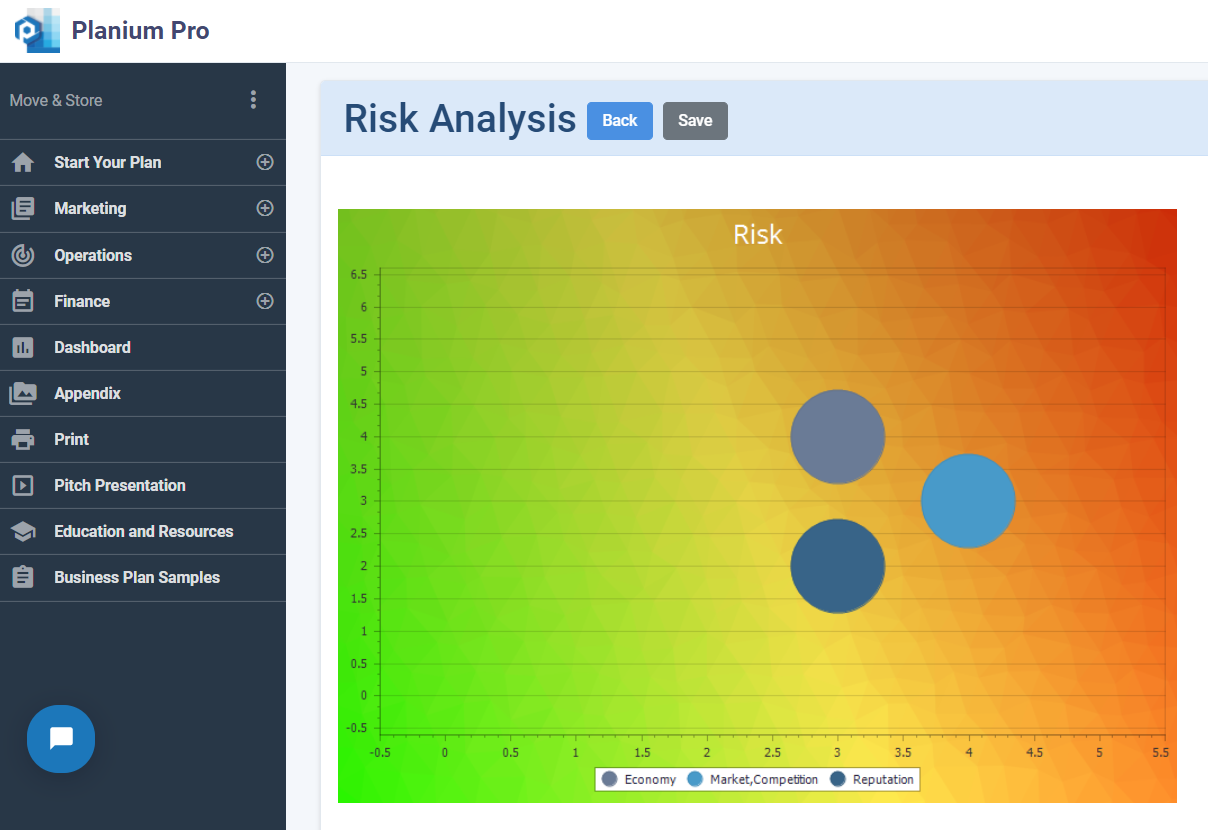
Under ‘Risk Analysis Introduction’, you have an option to leave a pre-written text and use the suggested template or press ‘Switch between Free Text/Template’ to input any introductory information that may benefit your client or investor.
‘Analysis Results’ is the section to write-up the analysis on the graph and describe any key themes that are present in the data or use the template text by pressing ‘Switch between Free Text/Template’
Click ‘Save’ to save changes.
Click ‘Report Preview’ to view the write-up in report format.
2.3.SWOT Analysis
SWOT Analysis was originally developed by Albert Humphrey in the 1960s, and has become a common and useful technique for identifying a business’ internal factors (e.g. strengths and weaknesses) and its external factors (e.g. opportunities and threats).
Using SWOT Analysis on Planium Pro Lite
To complete this section, on the left-hand side menu bar, click the + to expand the ‘Marketing’ menu and select ‘SWOT’. To add a new factor, click on ‘New’ in the top left corner of each table. When an empty field appears, add in the factor and rank it on:
- Scope: the range of impact
- Significance: the degree of impact
- Strategic Influence: the influence within the business
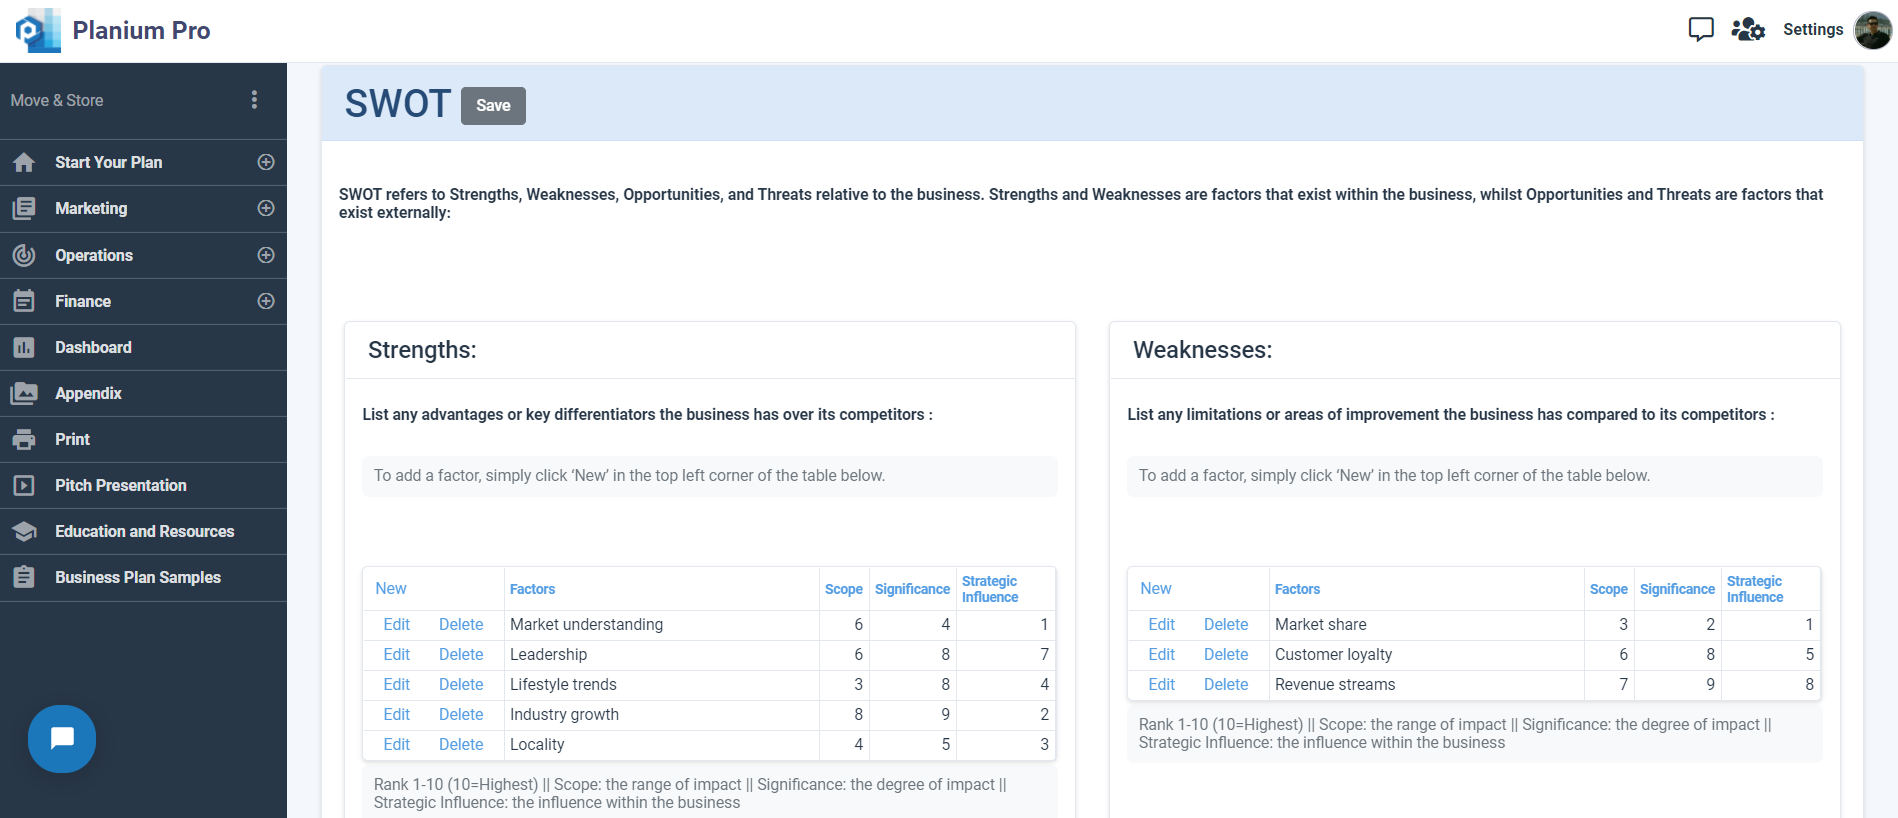
Strengths
List any advantages or key differentiators the business has over its competitors. Questions to consider asking about the business are:
- Does the business have any existing proven product and/or design concepts with fulfilled sales orders?
- Does the business have any unique patented positions in a niche area with premium capacity?
- Does the business have any worldwide brands or reputation in the field of play?
- Does the business have a diverse customer type or broad geographical reach?
Weaknesses
List any limitations or areas of improvement the business has compared to its competitors. Questions to consider asking about the business are:
- Are there any constraints against local or global objectives and market potential?
- Are there any areas that competitors have an advantage or edge?
- Is there any necessary expertise, licenses or inputs that is currently lacking?
- Are there any financial constraints that may weaken the prospects of the business?
Opportunities:
List any opportunities that exist for the business, such as emerging needs or underserved markets. Questions to consider asking about the business are:
- Are there any pent-up customer demands in current markets that could be met?
- Are there any economical, social or political trends that the business could potentially benefit from?
- Are there any competitor or supplier weaknesses that the business could potentially benefit from?
Threats:
List any threats that exist for the business, such as new competitors, negative media, or customer attitudes. Questions to consider asking about the business are:
- Are there any negative political and social trends impacting on the business?
- Are there any negative economic trends impacting on the business?
- Are there any negative technological trends impacting on the business?
- Are there any customer or supplier weaknesses that may damage the business?
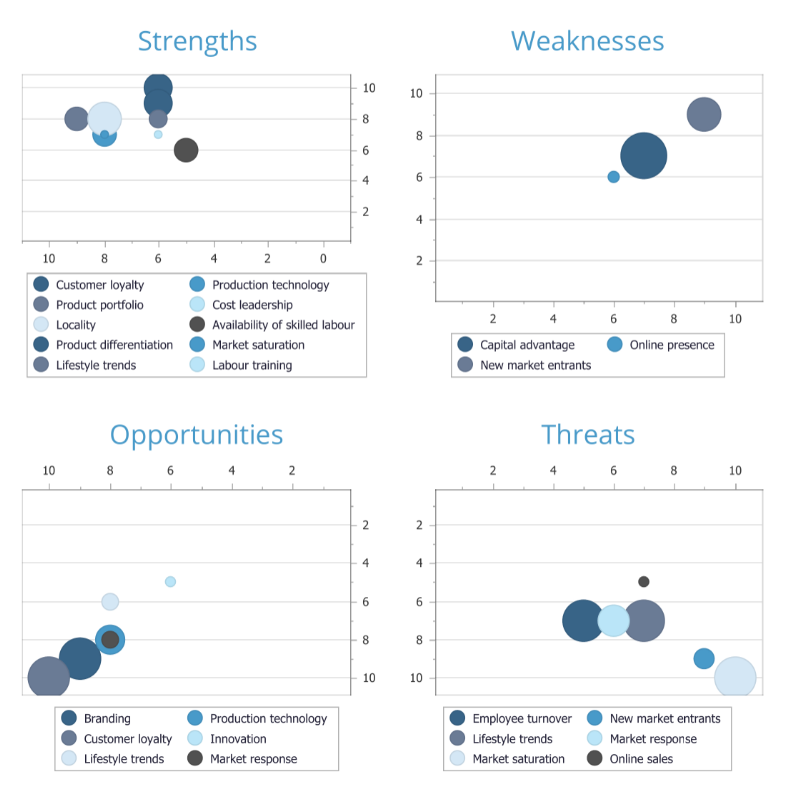
Click ‘Save’ to save changes.
Click ‘Chart Preview’ to view the analysis results.
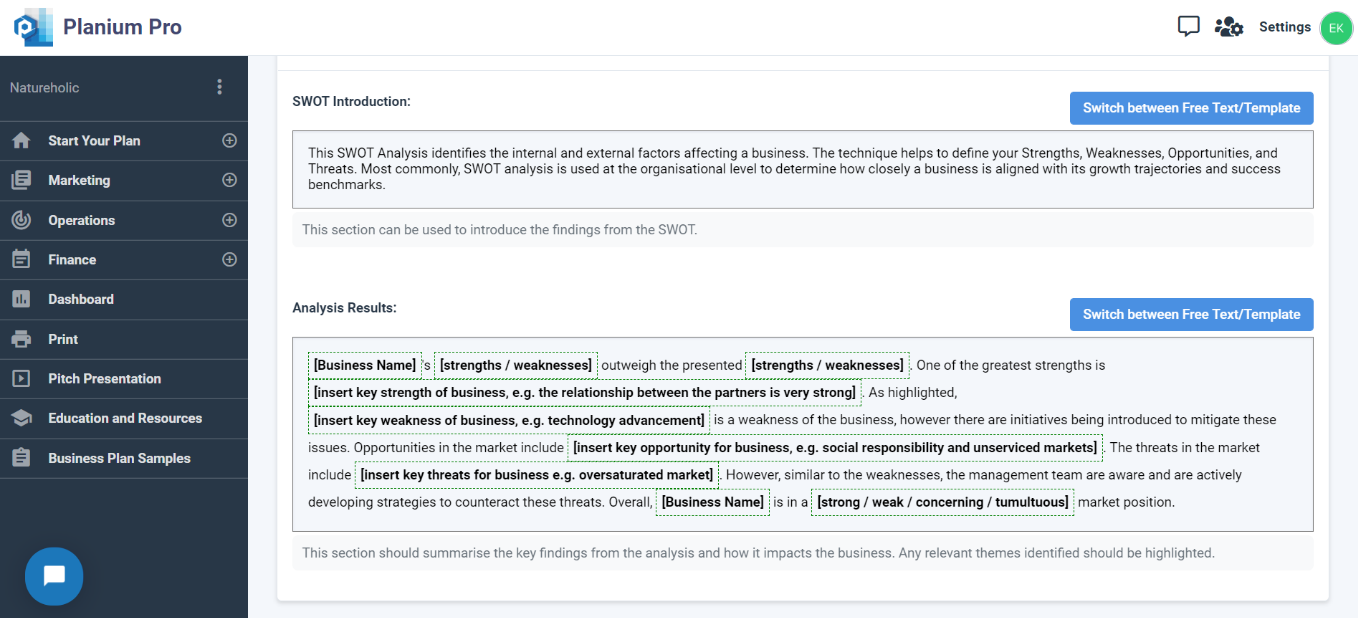
Analysing Five Forces Results on Planium Pro Lite
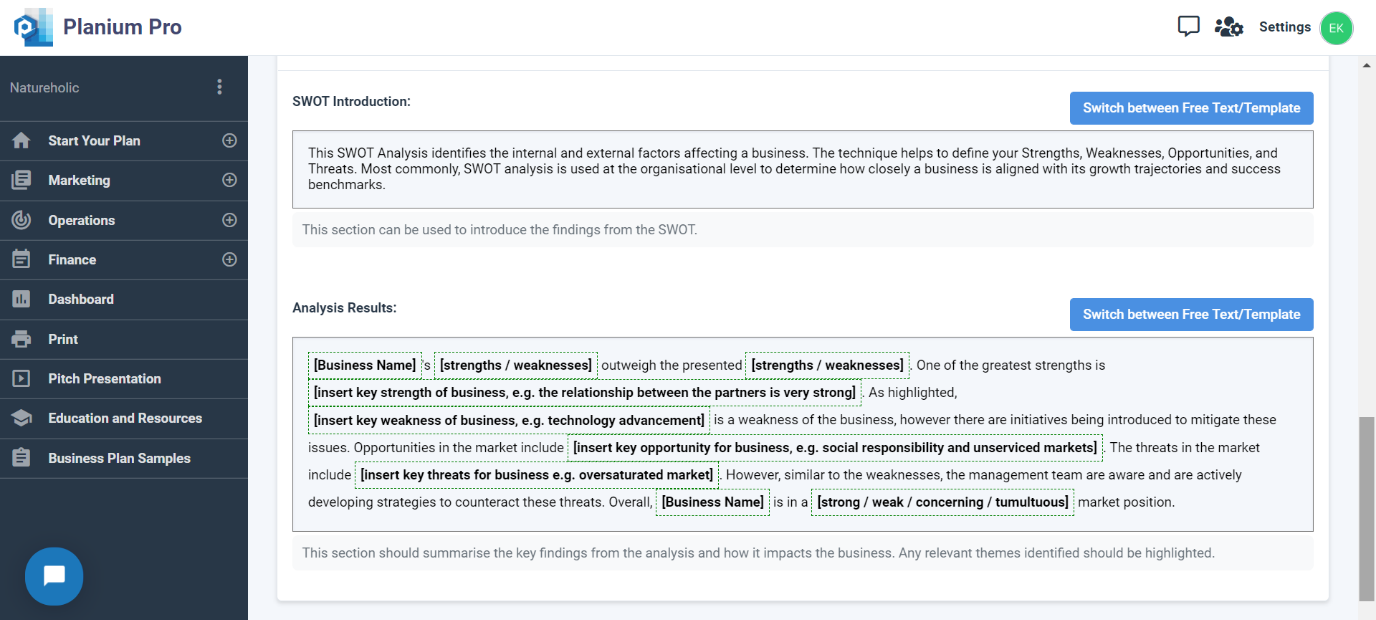
Under ‘SWOT Introduction’, you have an option to leave a pre-written text and use the suggested template or press ‘Switch between Free Text/Template’ to input any introductory information that may benefit your client or investor.
‘Analysis Results’ is the section to write-up the analysis on the graph and describe any key themes that are present in the data or press ‘Switch between Free Text/Template’ to use the template text.
Click ‘Save’ to save changes.
Click ‘Report Preview’ to view the write-up in report format.
2.4.Segment Analysis
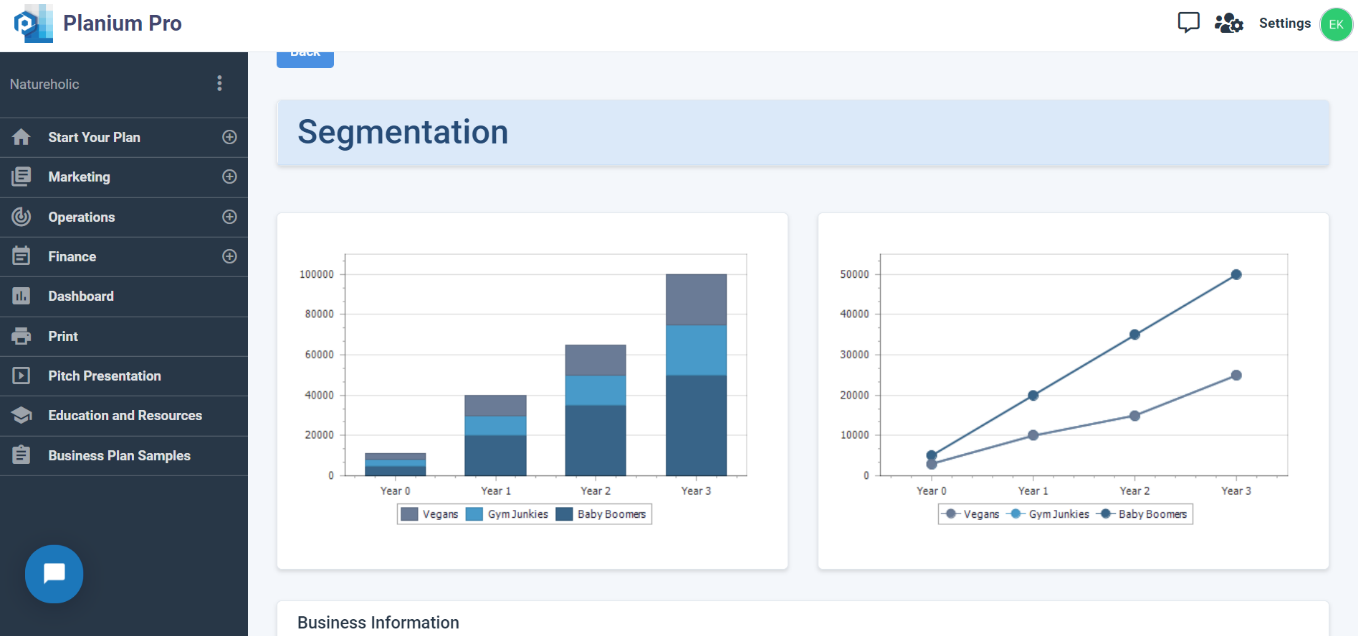
Market segmentation can be defined as the process of dividing a market into groups or subgroups based on distinct needs, characteristics, or behaviour which might require separate products or marketing mixes. The aim is to match groups of potential customers who have the same set of needs and buyer behaviour. Segmentation encourages businesses to use resources effectively, creates value for the target market, creates focus and effective positioning. However, one of the limitations of marketing segmentation is that targeting multiple segments increases marketing costs.
Requirements for effective segmentation:
Measurable and identifiable: it must be possible to determine the key variables.
Accessible: the segments can be reached and served.
Substantial: the segments should be sufficiently large to be served and profitable.
Actionable: programs can be developed effectively.
Unique needs: the segment must respond differently to the market.
Using Segment Analysis on Planium Pro Lite
To complete this section, on the left-hand side menu bar, click the + to expand the ‘Marketing’ menu and select ‘Segment Analysis’
Step 1: Segmentation
The segmentation process begins by identifying all potential segments that the market can be broken into. This is followed by diving further into creating sub-segments if applicable. Lastly, each segment will have different elements that have to be identified and described.
This process will provide a step-by-step guide to segment the market. Add one segment at a time. All the segments identified will be listed below.
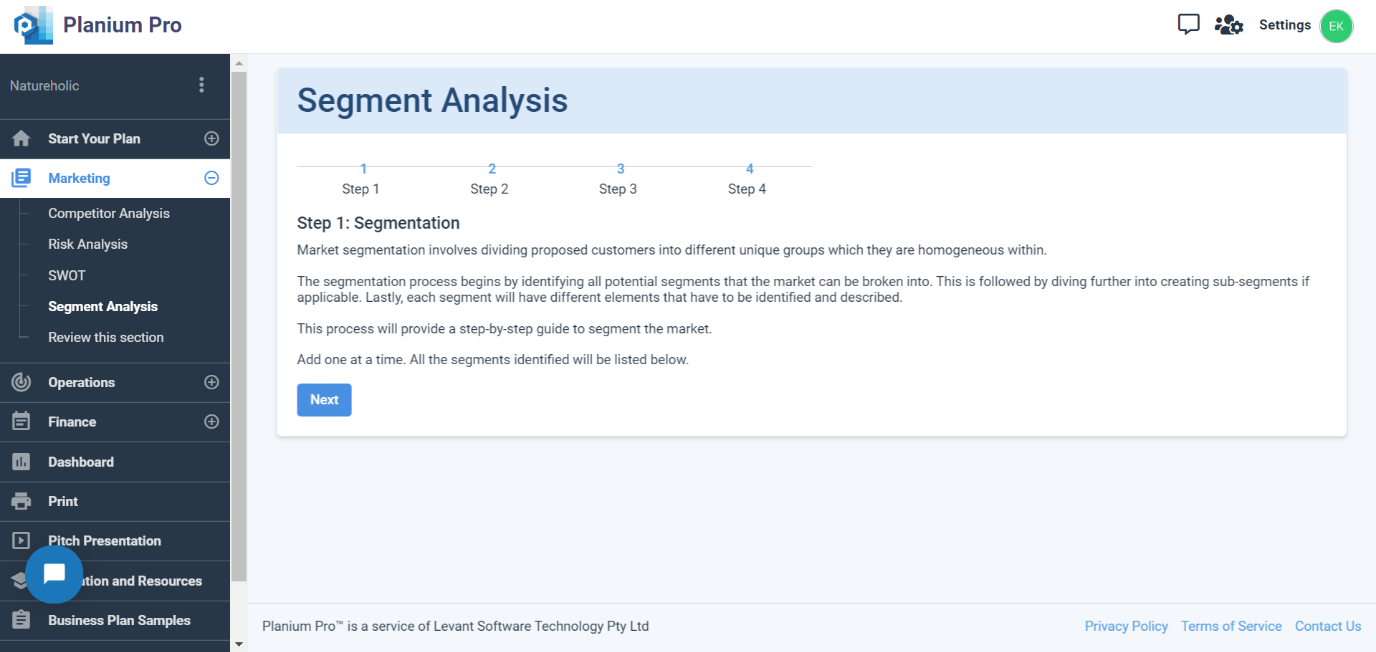
Click ‘Next’ to start the segmentation process.
Step 2: Add a new Segment
Choose a common variable for your market segmentation:
- Demographics – age, gender, family status, income, occupation.
- Behaviour – Purchasing behaviour, product usage, preferences, decision making.
- Psychographics – lifestyle, activities, interests, opinions.
- Firmographics (organisation-based)- number of employees, revenue, industry location.
Type the common variable which segments the proposed market in the box below and click ‘Add’. Add as many segments the business may have.
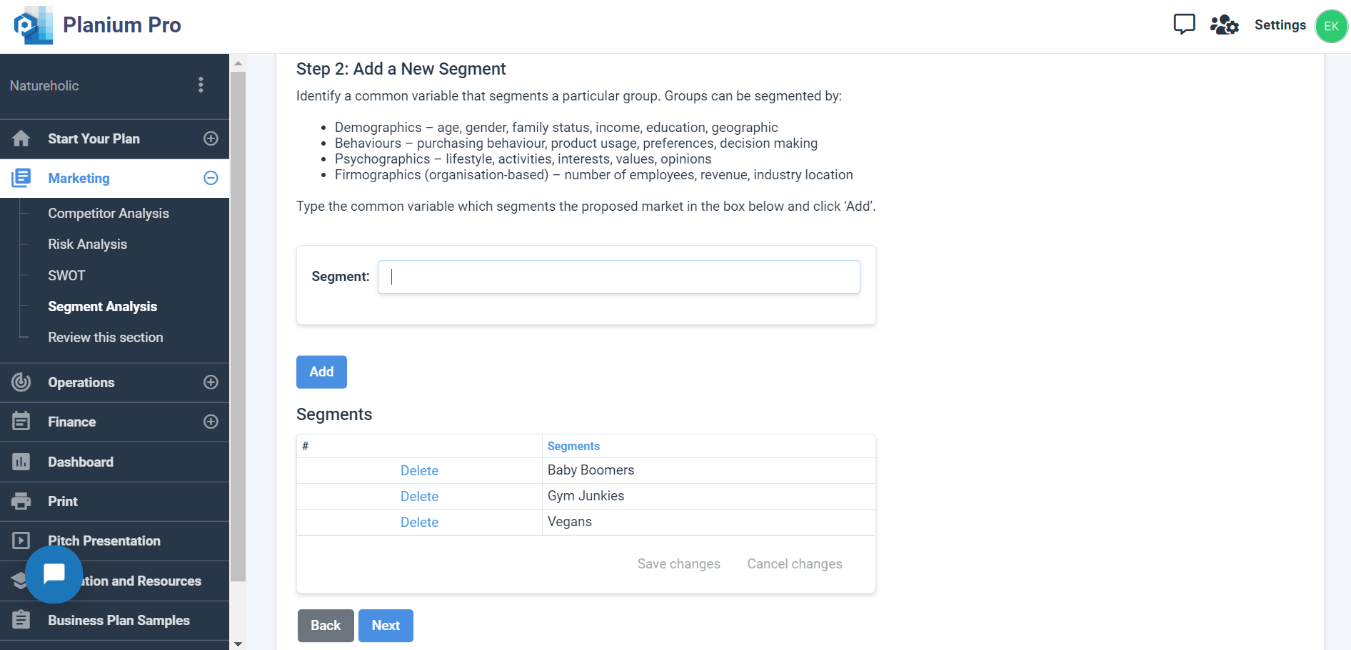
Click ‘Next’ to move to the next step in the segmentation process.
Step 3: Segment Structure
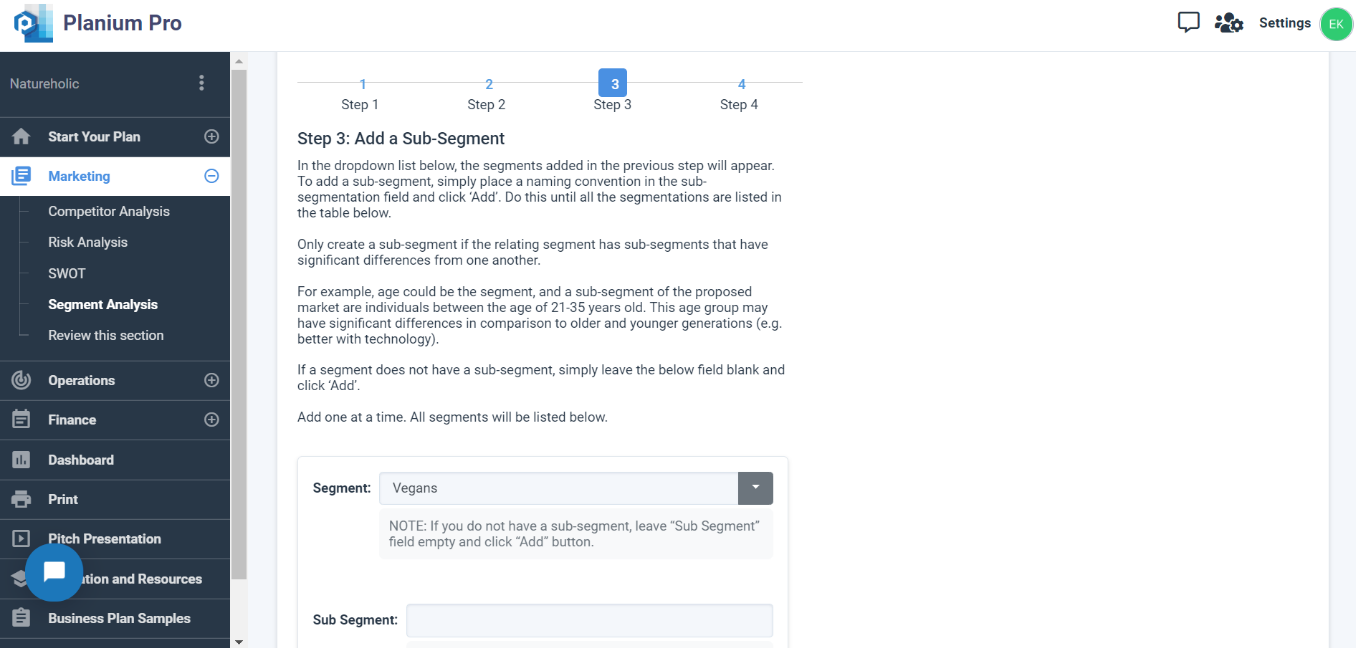
- Segment: If there is sub-segment, then leave this field empty and click ‘Add’
- Sub Segment: only create a sub-segment if the relating segment has sub-segment that have significant difference from one another.
Click ‘Next’ to move to the next step in the segmentation process.
Step 4: Segmentation Details
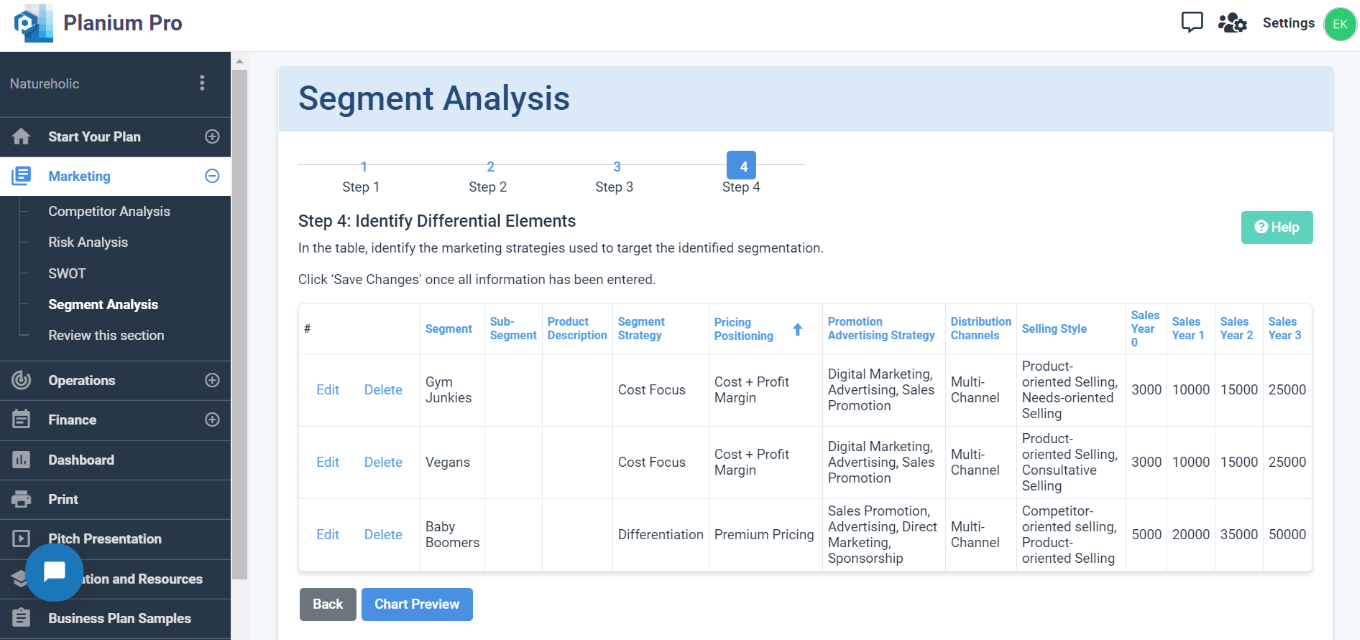
This final stage produces a summary table where you can identify the type of pricing positioning, marketing strategy and distribution channels should be used in each segment.
Click ‘Save’ to save changes.
Click ‘Chart Preview’ to view the analysis results.
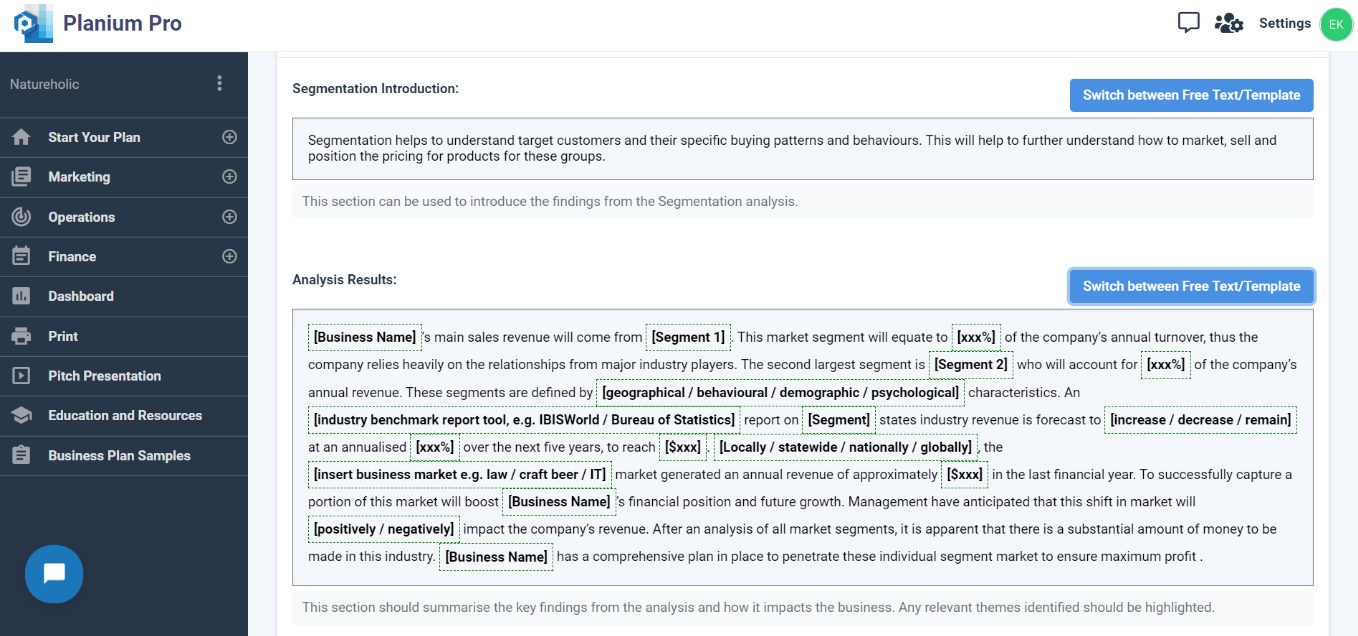
Analysing Segment Analysis Results on Planium Pro Lite
Under ‘Segment Analysis Introduction’, you have an option to leave a pre-written text and use the suggested template or press ‘Switch between Free Text/Template’ to input any introductory information that may benefit your client or investor.
‘Analysis Results’ is the section to write-up the analysis on the graph and describe any key themes that are present in the data. Press ‘Switch between Free Text/Template’ to use the template.
Click ‘Save’ to save changes.
Click ‘Report Preview’ to view the write-up in report format.
3.Operations
This section details the processes and procedures to effectively and efficiently deliver the product or service. Any existing suppliers, equipment, inventory or software should be outlined. The focus in this section is on the implementation aspect of the business plan.
3.1.Routine Processes
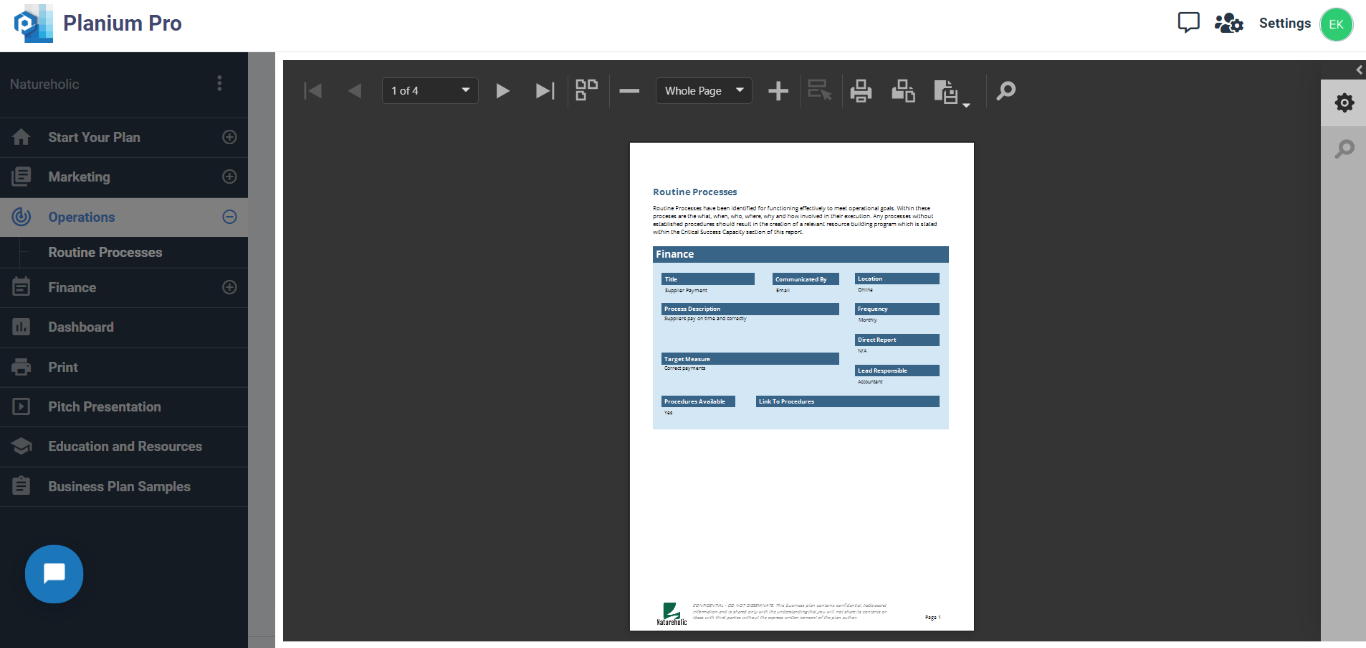
Typically, a company that manages its affairs with regular processes, procedures and communication tend to have lower transaction costs and more efficient way of conducting its business. Processes, procedures and communication are tantamount with management of the business – and should all be focused toward delivering value for the customer.
The key difference between processes and procedures are outlined below:
- A process typically defines what needs to be done, at what time and by what function, it describes the necessary actions and requires having an element of what is called pre-audacity and an element of responsible function. Once the process is determined as per previously mentioned parameters, the question of how it is done is embodied in a procedure.
- A procedure is typically textual, with diagrams, simplified, and explains how to do something. While a process is commonly a diagram that shows what, when and who, a procedure then explains how it is done.
Using Routine Processes on Planium Pro Lite
To complete this section, on the left-hand side menu bar, click the + to expand the ‘Operations’ menu and select ‘Routine Processes’.
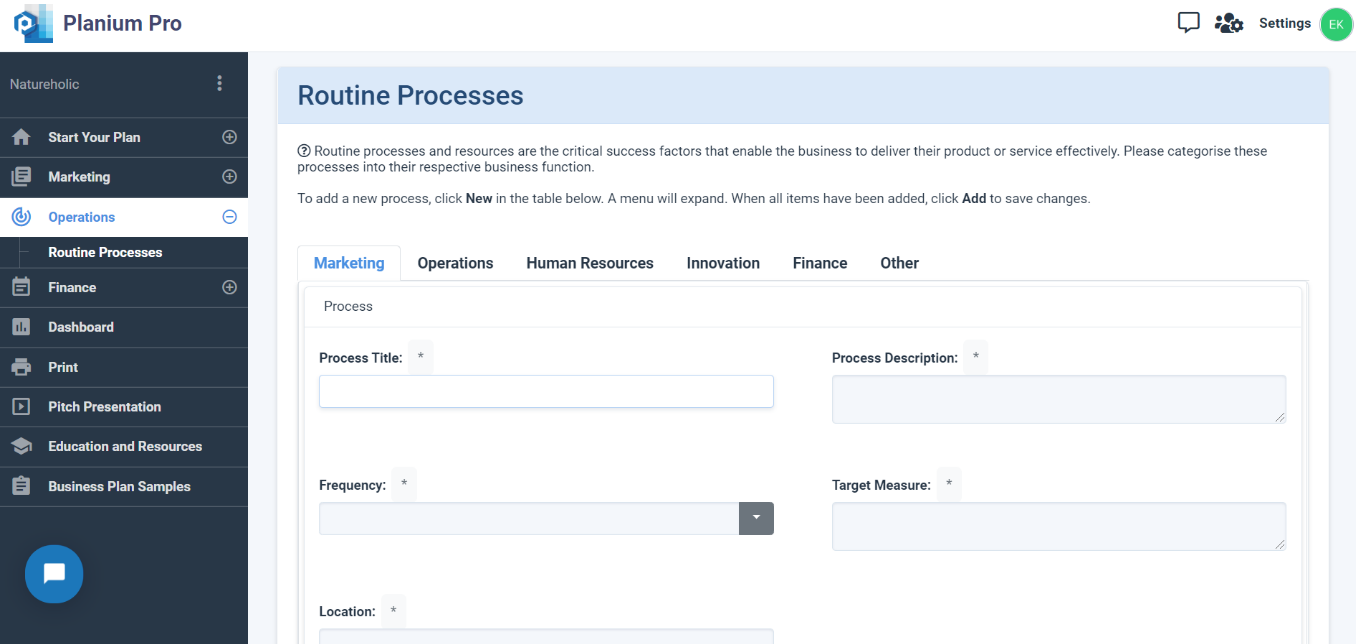
To add a new process, click ‘New’ in the table below and new fields will expand. Record any routine processes under the relevant resource tab.
- Marketing
- Operations
- Human Resources
- Innovation
- Finance
- Other
Click ‘Update’ to save changes.
Click ‘Report Preview’ to view the write-up in report format.
4.Finance
Finance
Financial plan is a summary of your business’s financial position and a forward-looking projection for growth that includes estimates of revenues, expenses and other values over several years. The Planium Pro Lite finance plan is high-level emphasis and easy to write plan that pinpoints only key financial elements.
It has three strategic steps, followed by report and benchmark.
Step One: Setup
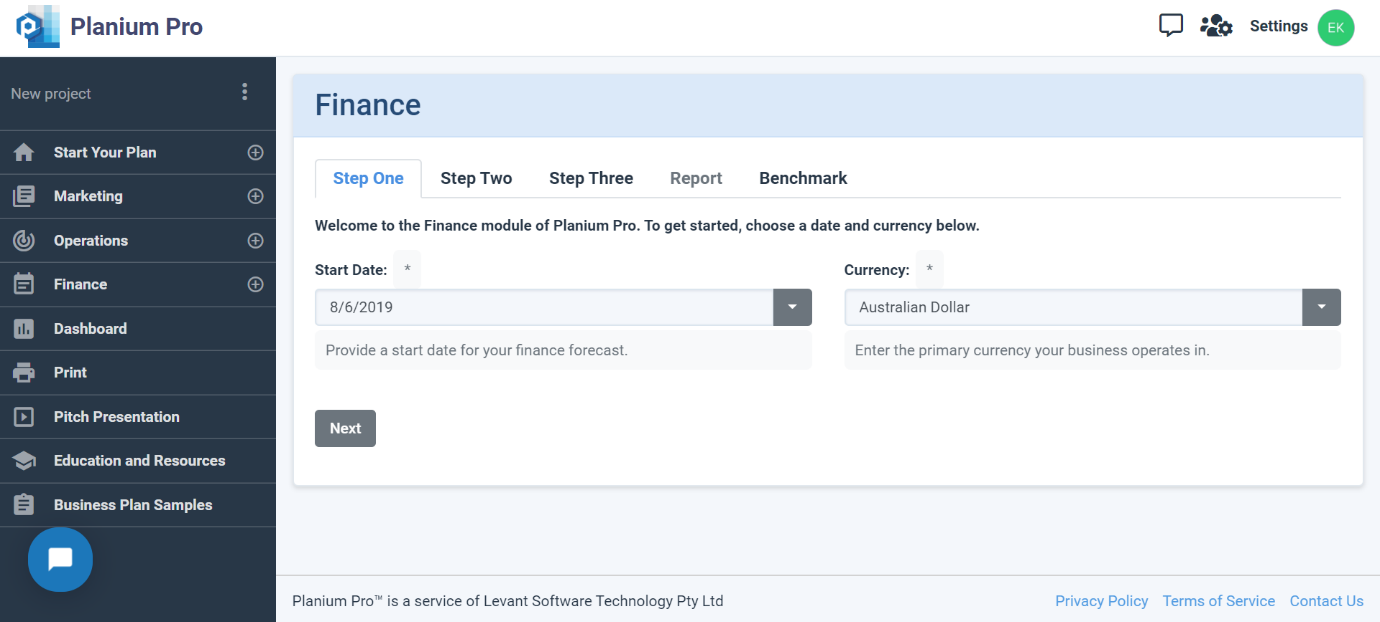
To complete this section, on the left-hand side menu bar, click ‘Finance’.
Use the selections to configure the finance settings below. These options are used throughout the Finance module and can be changed at any time.
- Click on ‘Enter a Start Date’ to establish a start date for your financial projections
- Click on ‘Enter a Currency’ to choose the currency for your business activities
Click on ‘Next’ to start the financial section.
Step two: Key Financial inputs for the current year
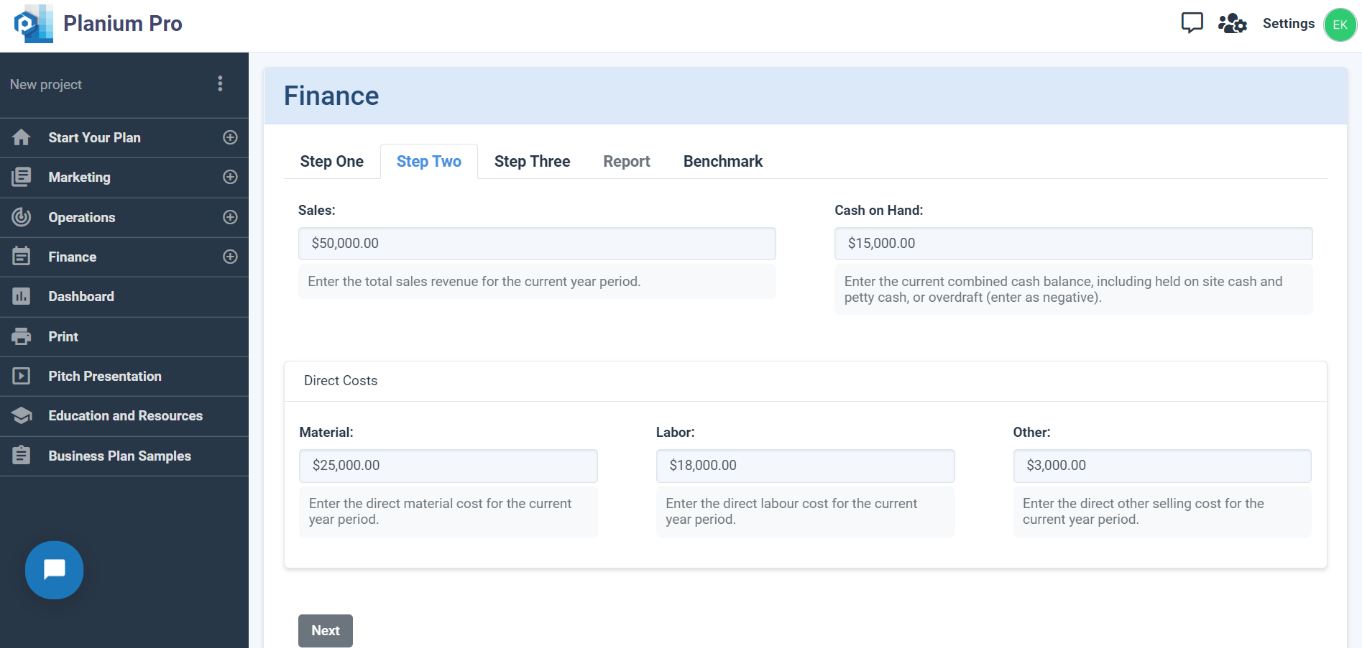
- Sales: Enter the total sales revenue for the current year period.
- Cash on Hand: Enter the current combined cash balance, including held on site cash and petty cash, or overdraft (enter as negative).
- Direct Costs:
- Material: Enter the direct material cost for the current year period.
- Labor: Enter the direct labour cost for the current year period.
- Other: Enter the direct other selling cost for the current year period.
Click on ‘Next’ to proceed further.
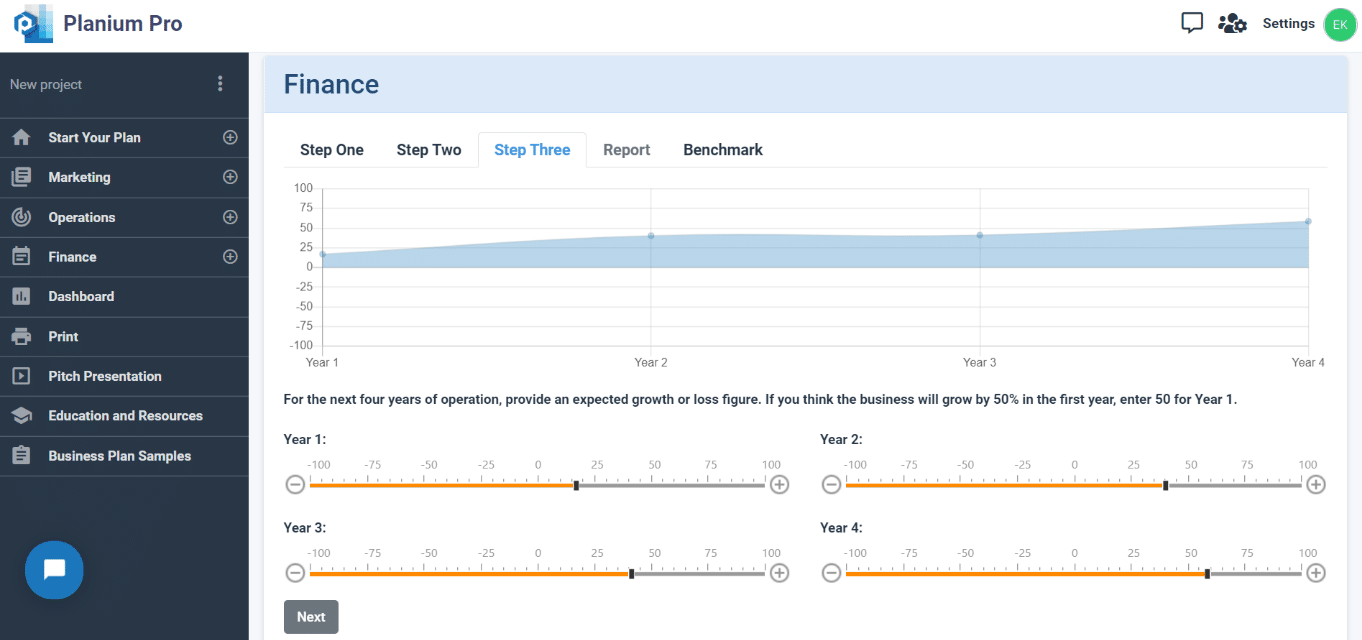
Step Three: Financial Projections
You need to have an estimate of your business growth for the next four years of operation. While it is tempting to be overly positive about your business growth, it is important to be as realistic as possible with financial projections.
To change the growth value, just scroll along the line of the respective year’s projections.
Click on ‘Next’ to see the ‘Report’ section.
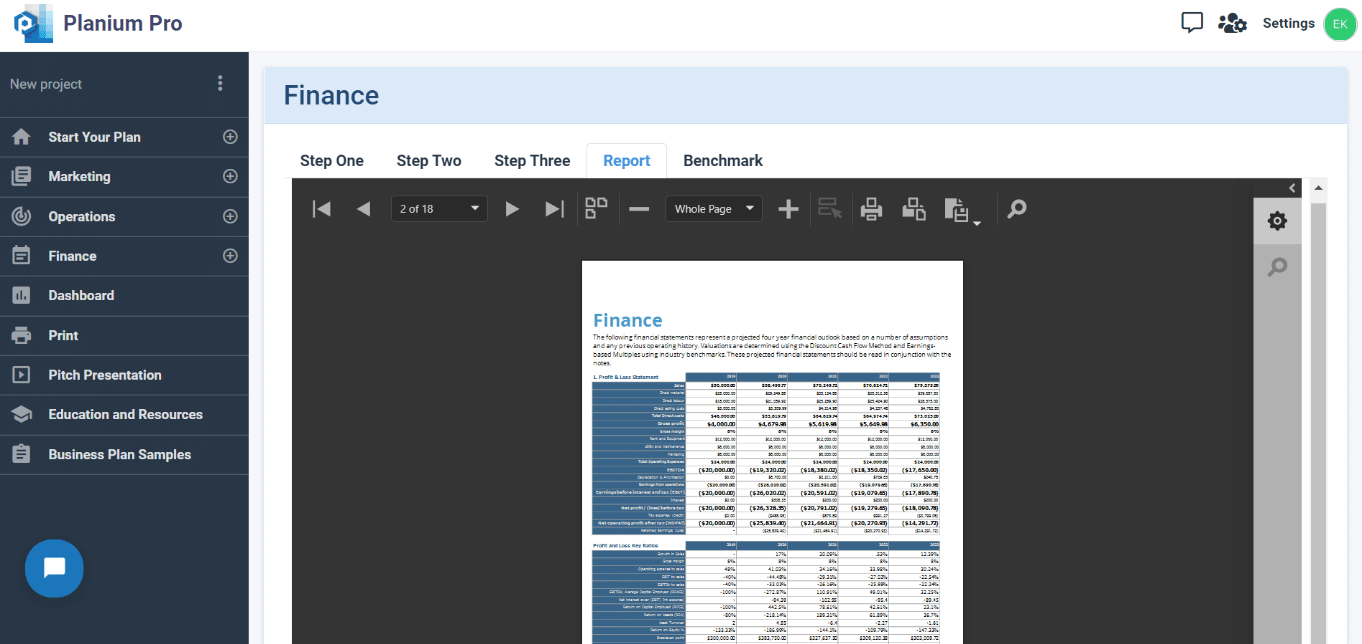
Report
Based on the financial data provided in the previous sections and your assumptions about business growth, you can see an automatically generated report that includes: the Profit and Loss Statement, the Balance Sheet, the Cash Flow Statement, and Valuation. You can print the report or export it to .docx or .pdf.
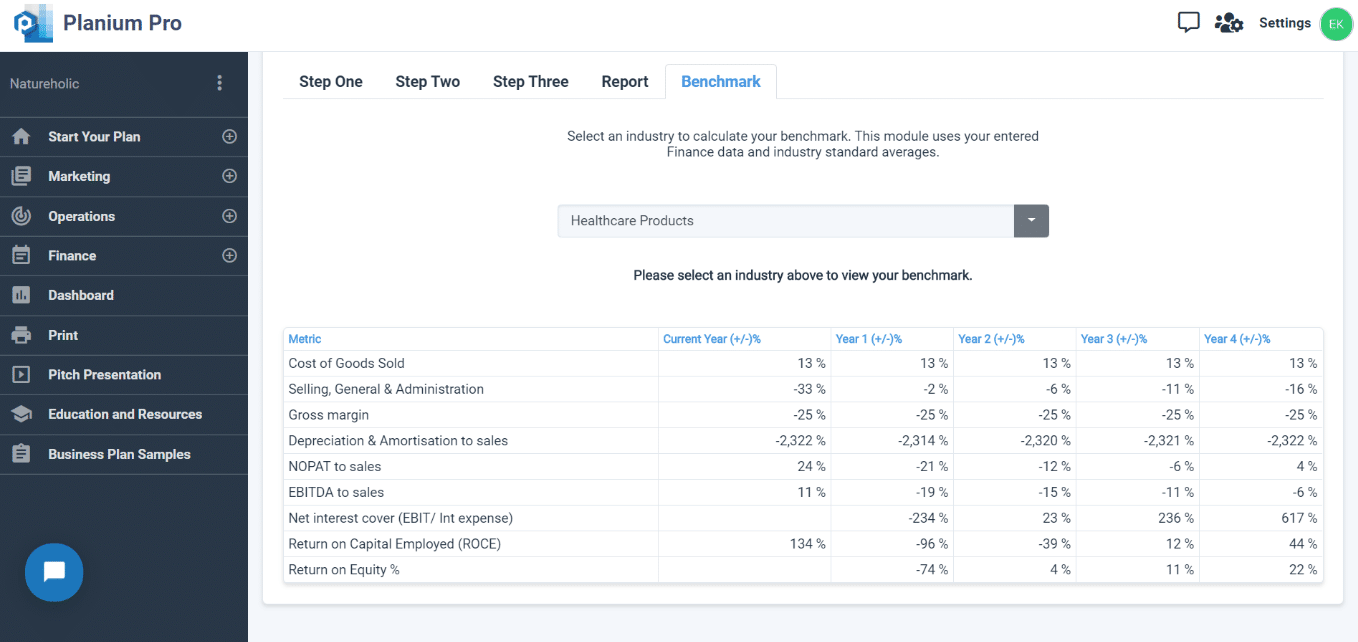
Benchmark
Sometimes it is hard to guess a percentage growth for your projections and gauge how well your business is doing, so the ‘Benchmark’ section gives you an opportunity to refer to reliable sources that provide financial data based on the real-world experience of companies in most industries. Benchmarks represent key financial ratios calculated from information provided by businesses on activity statements and tax returns.