5 Key Financial Metrics & KPIs for Small Businesses


Recent Posts
It’s important for small-business owners to consider their companies’ financial health, and financial metrics and key performance indicators (KPIs). Financial metrics for small businesses provide insight into the company’s actual financial situation as well as its short- and long-term prospects.
Financial metrics and KPIs help small companies determine if they have enough cash on hand to finance large capital investments—or if they are on the verge of bankruptcy. These figures are crucial for business owners, but lenders and investors may want to check them before signing any contracts with a company.
There are several metrics and KPIs that are critical to a small business’s performance.
What are KPIs?
KPIs, or key performance indicators, are metrics that are especially important to your business. According to Bernard Marr, a company that specialises in intelligent business performance, ‘KPIs provide a way to measure how well companies, business units, projects, or individuals are performing in relation to their strategic goals and objectives’. The company describes KPIs as ‘vital navigational instruments’ that provide a ‘clear picture of current levels of performance and whether the business is where it needs to be.’
These figures are the most important in determining whether your business succeeds and expands or fails and closes. KPIs differ from other metrics in that they typically have preset goals. Which is not always true for metrics – an organisation can track metrics for years without having specific targets in mind. Some financial metrics such as profitability and cash flow are important metrics in a company’s immediate and long-term survival, so these financial indicators are often considered as KPIs. Small-business owners should select their key performance indicators (KPIs) early on and have a good understanding of what numbers would show success.
Defining and Choosing the Right KPIs and Metrics for Small Businesses
Small-business leaders must pay attention to a variety of metrics, and KPIs are much more complex, depending on the market, business, and financial model, as well as goals. The leadership team should start by defining business goals for the quarter or year, then work backwards to define the KPIs and indicators that will keep them on track. To insure that priorities are applicable to the whole business, these conversations should include staff from all main departments.
To achieve your business objectives, you need to develop your own KPIs. The objectives of one company can be vastly different from those of another. You have some leeway when it comes to creating KPIs, but make sure they follow these four criteria:
- They are achievable: Your KPIs should show you the changes you need to make to support your company in a tangible and objective way.
- You can accurately calculate them: It should be simple to keep track of your KPIs. The most effective KPIs are simple to measure and understand. KPIs should be well-defined, measurable indicators.
- They are timely: You won’t be able to get a sense of what’s going on right now if you just use old info. It’s just useful to use old data as a reference method for new data.
- They have an impact on the bottom line: Whether your target is to boost net profit margins or increase consumer loyalty and retention, an increase in your KPIs can help you get closer to your objective.

However, there are a few common financial metrics that all businesses should be aware of. They must understand overall income, expenditures, assets, and liabilities, as well as how it changes over time. Many young businesses are interested in the cost of customer acquisition and the length of time those customers stay with them, also known as the churn rate. Tracking the efficiency of various processes and employee productivity at manufacturing plants or warehouses is also critical for product-based businesses.
5 key business metrics you should track to measure performance
Although it’s up to you to determine which KPIs are best for your firm, we’ve included five of the most relevant KPI metrics that small business owners should consider using.
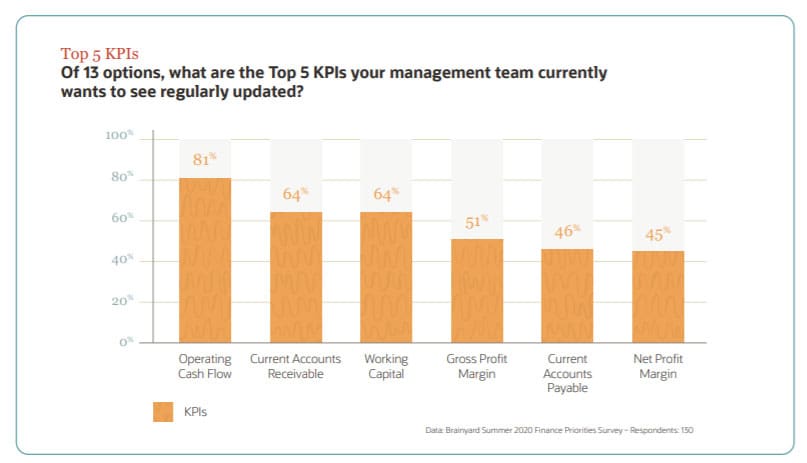
- Operating Cash Flow Forecast
Cash flow is just what it sounds like: the amount of money that flows in and out of your business. Cash flow is critical for all businesses, but it is especially critical for small businesses, which often operate on razor-thin margins.
Even if there is a lot of demand for your product or service, it’s easy to go bankrupt if you don’t have your cash flow under control. If you send out an invoice on the 30th and need the money to pay your office’s rent on the 7th, you will find yourself in trouble if the client does not pay on time. Calculating your cash flow forecast can assist you in planning for the future and avoiding situations like this.
The formula is as follows:
Operating Cash Flow = Net Income + Non-Cash Expenses – Increase in Working Capital
- Sales Revenue
Tracking sales revenue helps to measure your performance. It’s the profit you gain by selling your goods after subtracting the expense of returned items. The effects of month-over-month or year-over-year sales tell you:
- What percentage of people are interested in buying your products
- If your marketing efforts are yielding positive results,
- Your performance vs. that of your competitors
You need to consider external factors that may influence your performance, such as market changes or competitor behaviour, when calculating Sales Revenue and setting targets. The data you collect will help you determine whether or not you need to make adjustments to increase your sales revenue. For example, maybe you’re overworked and need to start recruiting new salespeople to take on more clients.
Increasing the amount of sales is the most straightforward way to raise sales revenue. This can be accomplished by expanding your marketing efforts, recruiting new salespeople, or making irresistible coupon deals. Instead of a swift (and temporary) increase in revenues, growing the sales revenue can be a long-term approach.
- Customer Loyalty and Retention
Customer loyalty is all about finding the right customers, getting them to purchase, buy often, buy in larger quantities, and refer you to their friends and family. Customer loyalty is built by treating customers the way they want to be handled.
Having a loyal client base is beneficial in a variety of respects. It aids in the sales and spreading awareness about the product. The Retention Rate indicates the percentage of customers who use your goods for a long time and buy from you again.
Consumer satisfaction and retention can be measured using three methods: 1) customer surveys, 2) direct feedback at the point of purchase, and 3) purchase analysis. Both of these things necessitate a structured and consistent method rather than haphazard implementation. According to Fred Reichheld and other researchers, a 5% rise in consumer satisfaction results in a 20 to 100 percent increase in income in a variety of industries.
Providing outstanding customer service and offering high-quality goods will improve customer satisfaction over time.
- Funnel Drop-Off Rate
The number of visitors who leave a conversion phase — or sales funnel — before it is completed is referred to as your funnel drop-off rate. To figure out how to measure funnel drop-off, start by calculating the number of visits for each conversion stage in the funnel. Then subtract the total number of visits from the total number of visits in the first step. To calculate the number of customers you lost along the way, divide the amount of each conversation step by the number of visits that occurred during the first step.
With so many small businesses using the internet as a sales tool and face-to-face engagement on the decline, the funnel drop-off rate has become one of the most important performance metrics to monitor.
- Revenue Growth Rate
Revenue growth is a financial KPI that measures the pace at which a company’s revenue, or sales, grows. To calculate your revenue growth rate, start with your current year’s total revenue. To calculate the rate of growth, divide current income by total revenue from the previous year. You may determine whether revenue growth is growing, declining, or plateauing, and by how much, by measuring the revenue growth rate on a regular basis.
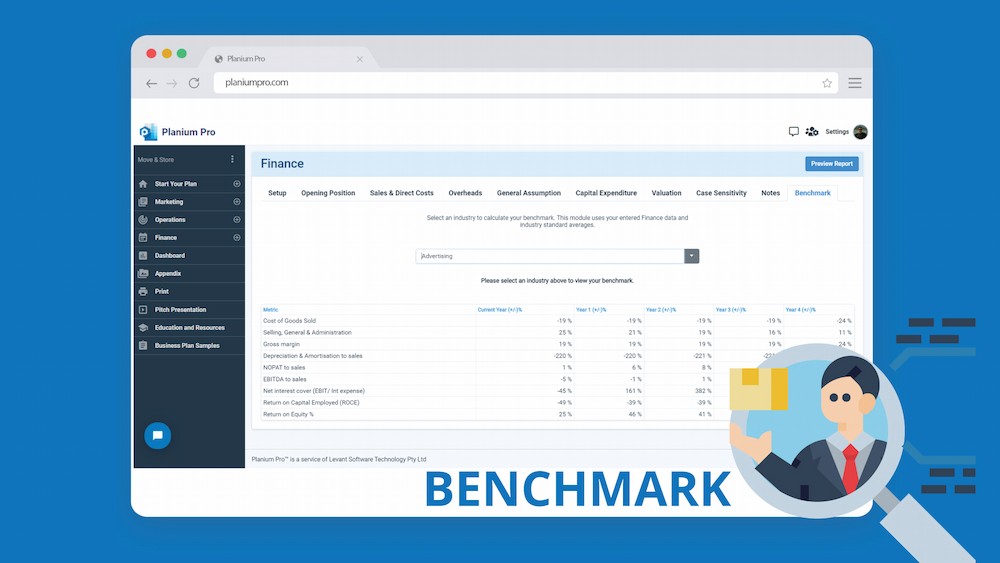
Sometimes it is handy to have an automated industry benchmarking tool to see how good your business stands in general in the industry. You can execute this easily using platform like Planium Pro. It helps you to compare some key financial metrics against the industry. From there, you can see how well you are placed.
You should be well-equipped to begin quantitatively measuring the company’s results with these KPIs in hand. But don’t end there; there are plenty of KPIs to choose from. Plus, you can always come up with something new.


